29
/pt/
pt
AIzaSyAYiBZKx7MnpbEhh9jyipgxe19OcubqV5w
April 1, 2024
170487
Korea, Rep.
KOR
true
2
1
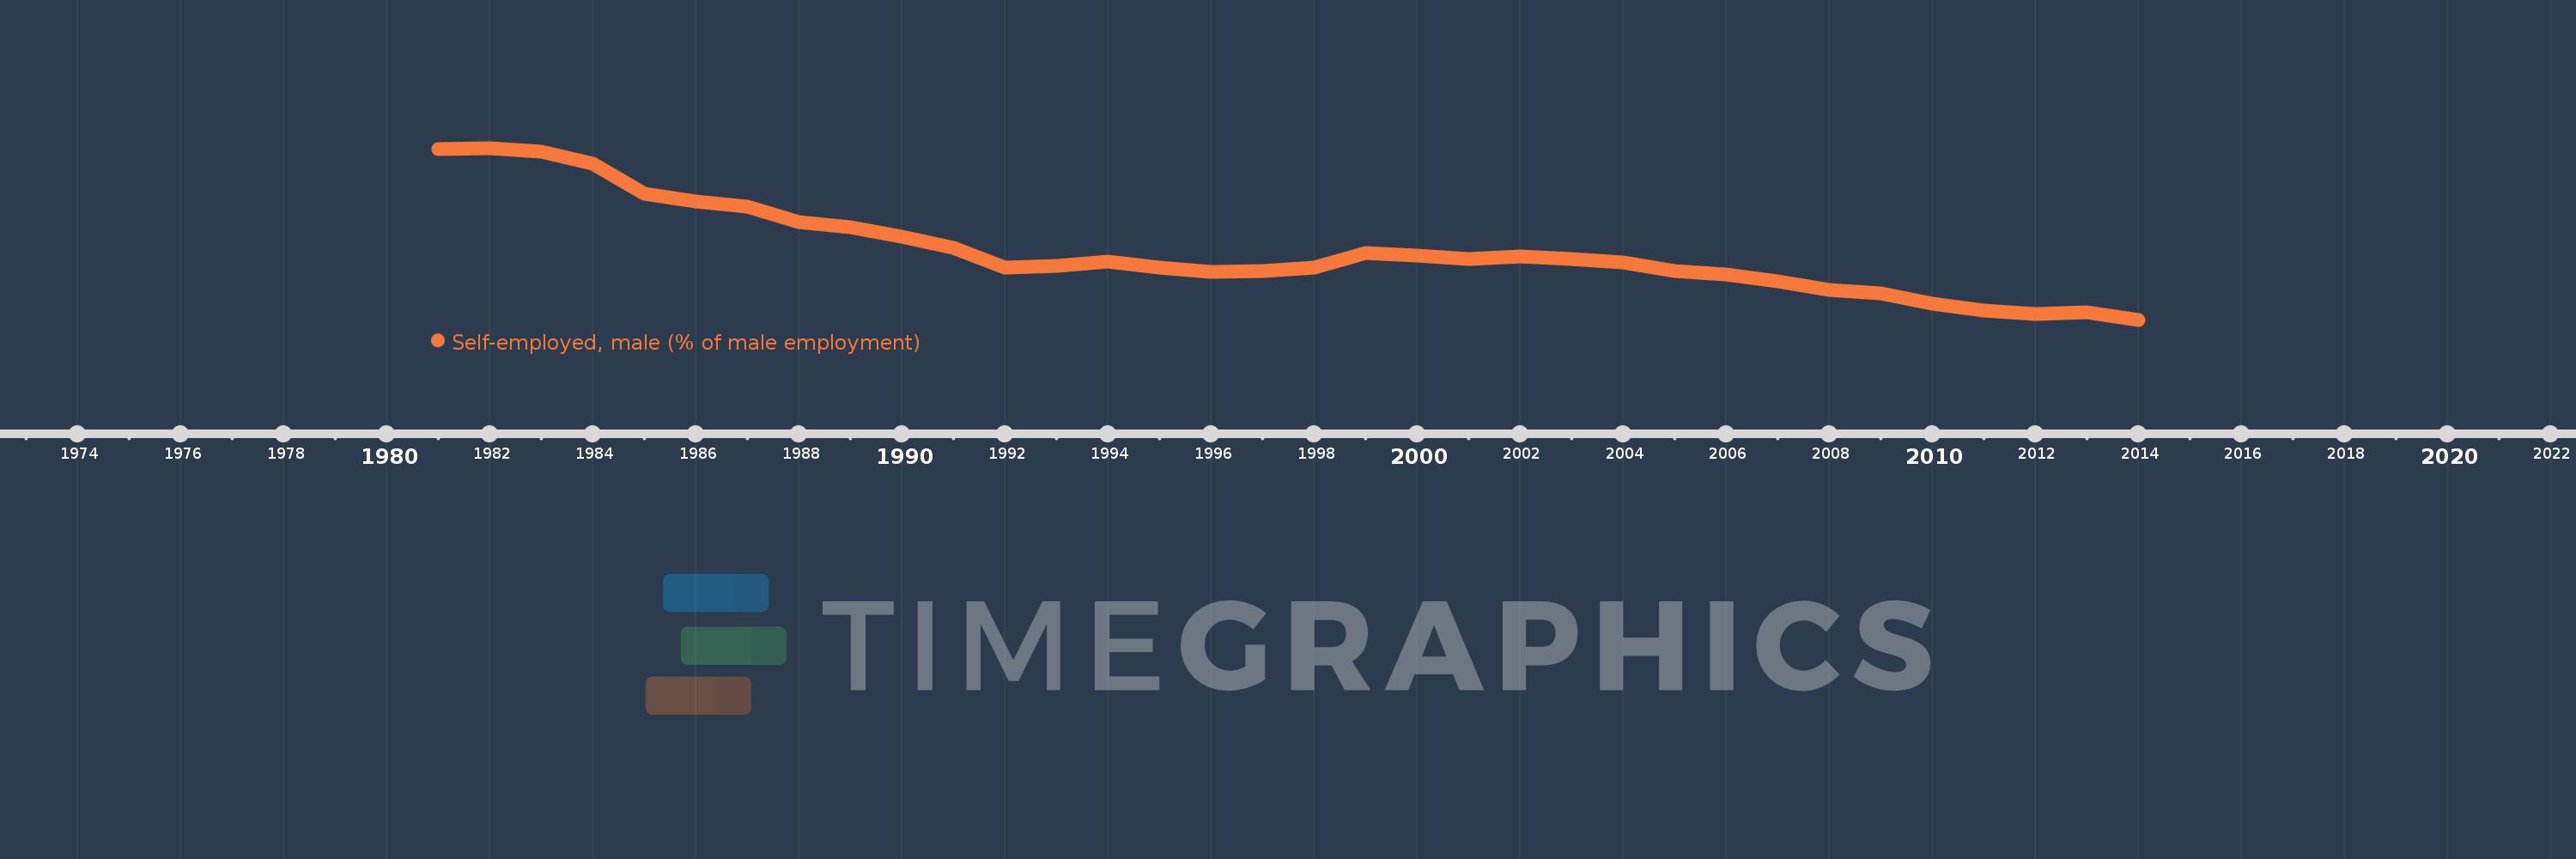
Self-employed, male (% of male employment)
2014,2013,2012,2011,2010,2009,2008,2007,2006,2005,2004,2003,2002,2001,2000,1999,1998,1997,1996,1995,1994,1993,1992,1991,1990,1989,1988,1987,1986,1985,1984,1983,1982,1981
Estas estatísticas em outros países:
AlbaniaAlgeriaAmerican SamoaAntigua and BarbudaArgentinaArmeniaArubaAustraliaAustriaAzerbaijanBahamas, TheBahrainBangladeshBarbadosBelarusBelgiumBelizeBeninBermudaBhutanBoliviaBosnia and HerzegovinaBotswanaBrazilBritish Virgin IslandsBrunei DarussalamBulgariaBurkina FasoBurundiCabo VerdeCambodiaCameroonCanadaCaribbean small statesCayman IslandsCentral Europe and the BalticsChadChileColombiaCongo, Rep.Costa RicaCote d'IvoireCroatiaCubaCyprusCzech RepublicDenmarkDjiboutiDominicaDominican RepublicEarly-demographic dividendEcuadorEgypt, Arab Rep.El SalvadorEquatorial GuineaEstoniaEthiopiaEuro areaEurope & Central AsiaEurope & Central Asia (excluding high income)Europe & Central Asia (IDA & IBRD countries)European UnionFijiFinlandFranceFrench PolynesiaGabonGambia, TheGeorgiaGermanyGhanaGreeceGrenadaGuatemalaGuineaGuyanaHaitiHigh incomeHondurasHong Kong SAR, ChinaHungaryIcelandIndiaIndonesiaIran, Islamic Rep.IrelandIsle of ManIsraelItalyJamaicaJapanJordanKazakhstanKenyaKiribatiKorea, Rep.KosovoKuwaitKyrgyz RepublicLao PDRLatin America & Caribbean Latin America & Caribbean (excluding high income)Latin America & the Caribbean (IDA & IBRD countries)LatviaLebanonLesothoLiberiaLithuaniaLower middle incomeLuxembourgMacao SAR, ChinaMacedonia, FYRMadagascarMalawiMalaysiaMaldivesMaliMaltaMarshall IslandsMauritiusMexicoMiddle East & North AfricaMiddle East & North Africa (excluding high income)Middle East & North Africa (IDA & IBRD countries)MoldovaMongoliaMontenegroMoroccoMozambiqueNamibiaNepalNetherlandsNew CaledoniaNew ZealandNicaraguaNigerNorth AmericaNorwayOECD membersOmanPakistanPanamaParaguayPeruPhilippinesPolandPortugalPost-demographic dividendPuerto RicoQatarRomaniaRussian FederationRwandaSamoaSan MarinoSao Tome and PrincipeSaudi ArabiaSenegalSerbiaSeychellesSierra LeoneSingaporeSlovak RepublicSloveniaSouth AfricaSouth AsiaSouth Asia (IDA & IBRD)SpainSri LankaSt. Kitts and NevisSt. LuciaSt. Vincent and the GrenadinesSurinameSwazilandSwedenSwitzerlandSyrian Arab RepublicTajikistanTanzaniaThailandTogoTongaTrinidad and TobagoTunisiaTurkeyTurks and Caicos IslandsTuvaluUgandaUkraineUnited Arab EmiratesUnited KingdomUnited StatesUruguayVanuatuVenezuela, RBVietnamWest Bank and GazaYemen, Rep.ZambiaZimbabwe Linha do tempo:
Nesta escala de tempo está apresentado um gráfico de 1981 ano até 2014 ano Korea, Rep.. Dados de 1980 ano ausente. O número de observações reais por data: 34.
Fonte (nome):
Indicadores de desenvolvimento mundial
Fonte (organização):
International Labour Organization, Key Indicators of the Labour Market database.
Categorias:
Social Protection & Labor, Gender
Foi atualizado:
23 abr 2017 ano
Indicadores de alterações dos valores ao longo dos anos
Mínimo:
29.0
1 jan 2014 ano
Máximo:
47.9
1 jan 1982 ano
Na data de observação
Valor
Mudança absoluta
A alteração em relação ao valor anterior
1 jan 1981 ano
47.8
+47.8
0.0%
1 jan 1982 ano
47.9
+0.1
0.21%
1 jan 1983 ano
47.5
-0.4
-0.84%
1 jan 1984 ano
46.2
-1.3
-2.74%
1 jan 1985 ano
42.9
-3.3
-7.14%
1 jan 1986 ano
42.0
-0.9
-2.1%
1 jan 1987 ano
41.4
-0.6
-1.43%
1 jan 1988 ano
39.7
-1.7
-4.11%
1 jan 1989 ano
39.2
-0.5
-1.26%
1 jan 1990 ano
38.1
-1.1
-2.81%
1 jan 1991 ano
36.9
-1.2
-3.15%
1 jan 1992 ano
34.7
-2.2
-5.96%
1 jan 1993 ano
34.9
+0.2
0.58%
1 jan 1994 ano
35.4
+0.5
1.43%
1 jan 1995 ano
34.7
-0.7
-1.98%
1 jan 1996 ano
34.3
-0.4
-1.15%
1 jan 1997 ano
34.4
+0.1
0.29%
1 jan 1998 ano
34.7
+0.3
0.87%
1 jan 1999 ano
36.3
+1.6
4.61%
1 jan 2000 ano
36.1
-0.2
-0.55%
1 jan 2001 ano
35.7
-0.4
-1.11%
1 jan 2002 ano
36.0
+0.3
0.84%
1 jan 2003 ano
35.7
-0.3
-0.83%
1 jan 2004 ano
35.3
-0.4
-1.12%
1 jan 2005 ano
34.4
-0.9
-2.55%
1 jan 2006 ano
34.0
-0.4
-1.16%
1 jan 2007 ano
33.2
-0.8
-2.35%
1 jan 2008 ano
32.3
-0.9
-2.71%
1 jan 2009 ano
31.9
-0.4
-1.24%
1 jan 2010 ano
30.8
-1.1
-3.45%
1 jan 2011 ano
30.0
-0.8
-2.6%
1 jan 2012 ano
29.6
-0.4
-1.33%
1 jan 2013 ano
29.8
+0.2
0.68%
1 jan 2014 ano
29.0
-0.8
-2.68%
Classificação de países por estatísticas atuais por anos


Comentários: