29
/pt/
pt
AIzaSyAYiBZKx7MnpbEhh9jyipgxe19OcubqV5w
April 1, 2024
168429
Kiribati
KIR
true
2
1
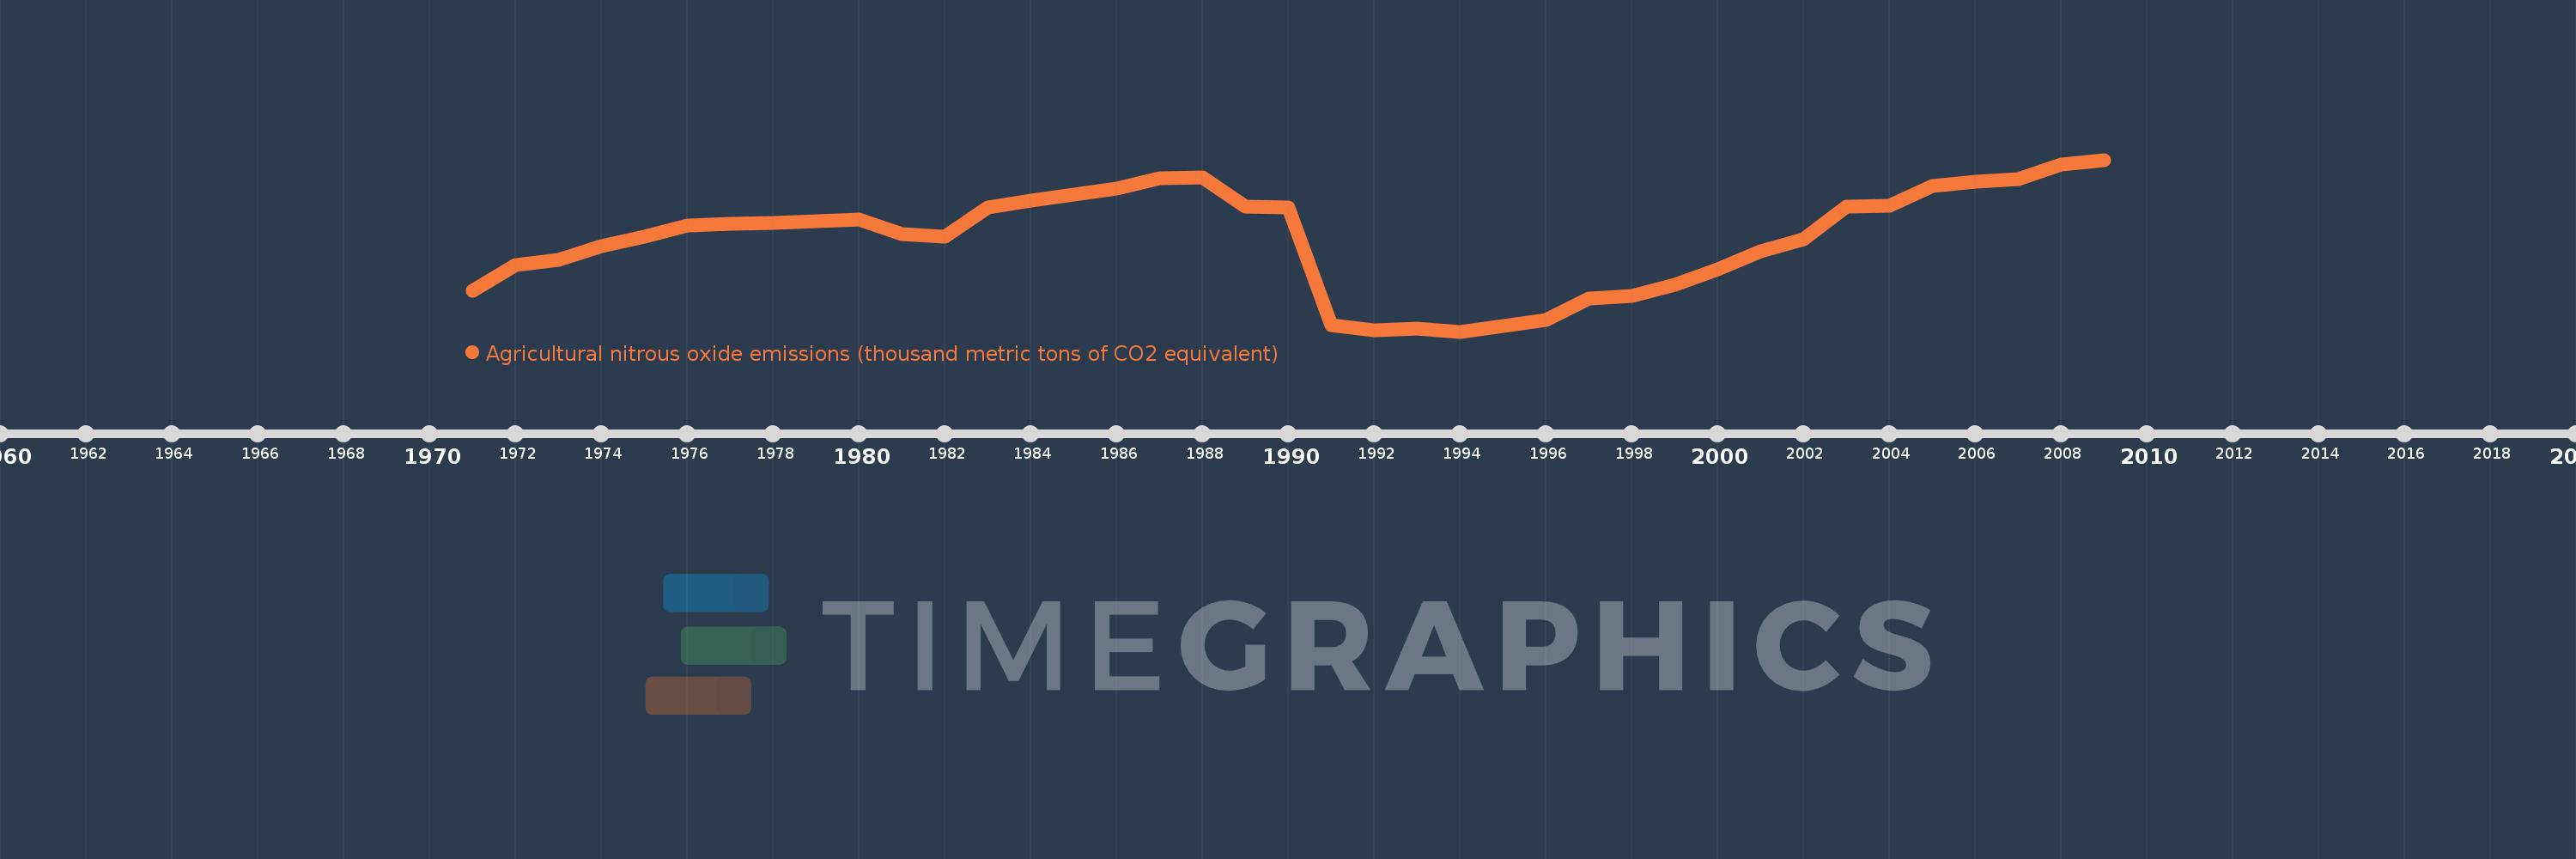
Agricultural nitrous oxide emissions (thousand metric tons of CO2 equivalent)
2009,2008,2007,2006,2005,2004,2003,2002,2001,2000,1999,1998,1997,1996,1995,1994,1993,1992,1991,1990,1989,1988,1987,1986,1985,1984,1983,1982,1981,1980,1979,1978,1977,1976,1975,1974,1973,1972,1971
Estas estatísticas em outros países:
AfghanistanAlbaniaAlgeriaAmerican SamoaAndorraAngolaAntigua and BarbudaArab WorldArgentinaArmeniaArubaAustraliaAustriaAzerbaijanBahamas, TheBahrainBangladeshBarbadosBelarusBelgiumBelizeBeninBermudaBhutanBoliviaBosnia and HerzegovinaBotswanaBrazilBritish Virgin IslandsBrunei DarussalamBulgariaBurkina FasoBurundiCabo VerdeCambodiaCameroonCanadaCaribbean small statesCayman IslandsCentral African RepublicCentral Europe and the BalticsChadChannel IslandsChileChinaColombiaComorosCongo, Dem. Rep.Congo, Rep.Costa RicaCote d'IvoireCroatiaCubaCuracaoCyprusCzech RepublicDenmarkDjiboutiDominicaDominican RepublicEarly-demographic dividendEast Asia & PacificEast Asia & Pacific (excluding high income)East Asia & Pacific (IDA & IBRD countries)EcuadorEgypt, Arab Rep.El SalvadorEquatorial GuineaEritreaEstoniaEthiopiaEuro areaEurope & Central AsiaEurope & Central Asia (excluding high income)Europe & Central Asia (IDA & IBRD countries)European UnionFaroe IslandsFijiFinlandFragile and conflict affected situationsFranceFrench PolynesiaGabonGambia, TheGeorgiaGermanyGhanaGibraltarGreeceGreenlandGrenadaGuamGuatemalaGuineaGuinea-BissauGuyanaHaitiHeavily indebted poor countries (HIPC)High incomeHondurasHong Kong SAR, ChinaHungaryIBRD onlyIcelandIDA & IBRD totalIDA blendIDA onlyIDA totalIndiaIndonesiaIran, Islamic Rep.IraqIrelandIsle of ManIsraelItalyJamaicaJapanJordanKazakhstanKenyaKiribatiKorea, Dem. People’s Rep.Korea, Rep.KosovoKuwaitKyrgyz RepublicLao PDRLate-demographic dividendLatin America & Caribbean Latin America & Caribbean (excluding high income)Latin America & the Caribbean (IDA & IBRD countries)LatviaLeast developed countries: UN classificationLebanonLesothoLiberiaLibyaLiechtensteinLithuaniaLow & middle incomeLow incomeLower middle incomeLuxembourgMacao SAR, ChinaMacedonia, FYRMadagascarMalawiMalaysiaMaldivesMaliMaltaMarshall IslandsMauritaniaMauritiusMexicoMicronesia, Fed. Sts.Middle East & North AfricaMiddle East & North Africa (excluding high income)Middle East & North Africa (IDA & IBRD countries)Middle incomeMoldovaMonacoMongoliaMontenegroMoroccoMozambiqueMyanmarNamibiaNauruNepalNetherlandsNew CaledoniaNew ZealandNicaraguaNigerNigeriaNorth AmericaNorthern Mariana IslandsNorwayOECD membersOmanOther small statesPacific island small statesPakistanPalauPanamaPapua New GuineaParaguayPeruPhilippinesPolandPortugalPost-demographic dividendPre-demographic dividendPuerto RicoQatarRomaniaRussian FederationRwandaSamoaSan MarinoSao Tome and PrincipeSaudi ArabiaSenegalSerbiaSeychellesSierra LeoneSingaporeSint Maarten (Dutch part)Slovak RepublicSloveniaSmall statesSolomon IslandsSomaliaSouth AfricaSouth AsiaSouth Asia (IDA & IBRD)South SudanSpainSri LankaSt. Kitts and NevisSt. LuciaSt. Martin (French part)St. Vincent and the GrenadinesSub-Saharan Africa Sub-Saharan Africa (excluding high income)Sub-Saharan Africa (IDA & IBRD countries)SudanSurinameSwazilandSwedenSwitzerlandSyrian Arab RepublicTajikistanTanzaniaThailandTimor-LesteTogoTongaTrinidad and TobagoTunisiaTurkeyTurkmenistanTurks and Caicos IslandsTuvaluUgandaUkraineUnited Arab EmiratesUnited KingdomUnited StatesUpper middle incomeUruguayUzbekistanVanuatuVenezuela, RBVietnamVirgin Islands (U.S.)West Bank and GazaWorldYemen, Rep.ZambiaZimbabwe Linha do tempo:
Nesta escala de tempo está apresentado um gráfico de 1971 ano até 2009 ano Kiribati. Dados de 1970 ano ausente. O número de observações reais por data: 39.
Fonte (nome):
Indicadores de desenvolvimento mundial
Fonte (organização):
European Commission, Joint Research Centre (JRC)/Netherlands Environmental Assessment Agency (PBL). Emission Database for Global Atmospheric Research (EDGAR): http://edgar.jrc.ec.europa.eu/
Categorias:
Agriculture & Rural Development, Environment
Foi atualizado:
23 abr 2017 ano
Indicadores de alterações dos valores ao longo dos anos
Mínimo:
1.29
1 jan 1994 ano
Máximo:
1.849
1 jan 2009 ano
Na data de observação
Valor
Mudança absoluta
A alteração em relação ao valor anterior
1 jan 1971 ano
1.422
+1.422
0.0%
1 jan 1972 ano
1.507
+0.085
5.98%
1 jan 1973 ano
1.524
+0.017
1.13%
1 jan 1974 ano
1.567
+0.043
2.82%
1 jan 1975 ano
1.6
+0.033
2.09%
1 jan 1976 ano
1.635
+0.035
2.18%
1 jan 1977 ano
1.642
+0.007
0.41%
1 jan 1978 ano
1.644
+0.002
0.14%
1 jan 1979 ano
1.649
+0.005
0.31%
1 jan 1980 ano
1.654
+0.005
0.27%
1 jan 1981 ano
1.608
-0.046
-2.77%
1 jan 1982 ano
1.599
-0.009
-0.58%
1 jan 1983 ano
1.693
+0.094
5.88%
1 jan 1984 ano
1.717
+0.024
1.44%
1 jan 1985 ano
1.735
+0.018
1.04%
1 jan 1986 ano
1.755
+0.02
1.16%
1 jan 1987 ano
1.789
+0.034
1.95%
1 jan 1988 ano
1.791
+0.002
0.11%
1 jan 1989 ano
1.698
-0.093
-5.21%
1 jan 1990 ano
1.693
-0.005
-0.29%
1 jan 1991 ano
1.312
-0.381
-22.5%
1 jan 1992 ano
1.295
-0.018
-1.34%
1 jan 1993 ano
1.299
+0.004
0.31%
1 jan 1994 ano
1.29
-0.009
-0.7%
1 jan 1995 ano
1.309
+0.02
1.54%
1 jan 1996 ano
1.328
+0.019
1.43%
1 jan 1997 ano
1.398
+0.07
5.23%
1 jan 1998 ano
1.406
+0.009
0.61%
1 jan 1999 ano
1.441
+0.035
2.5%
1 jan 2000 ano
1.493
+0.052
3.59%
1 jan 2001 ano
1.552
+0.059
3.92%
1 jan 2002 ano
1.591
+0.039
2.52%
1 jan 2003 ano
1.696
+0.105
6.6%
1 jan 2004 ano
1.699
+0.004
0.22%
1 jan 2005 ano
1.765
+0.066
3.86%
1 jan 2006 ano
1.779
+0.014
0.81%
1 jan 2007 ano
1.787
+0.008
0.43%
1 jan 2008 ano
1.834
+0.047
2.62%
1 jan 2009 ano
1.849
+0.016
0.85%
Classificação de países por estatísticas atuais por anos


Comentários: