29
/pt/
pt
AIzaSyAYiBZKx7MnpbEhh9jyipgxe19OcubqV5w
April 1, 2024
167952
Kenya
KEN
true
2
1
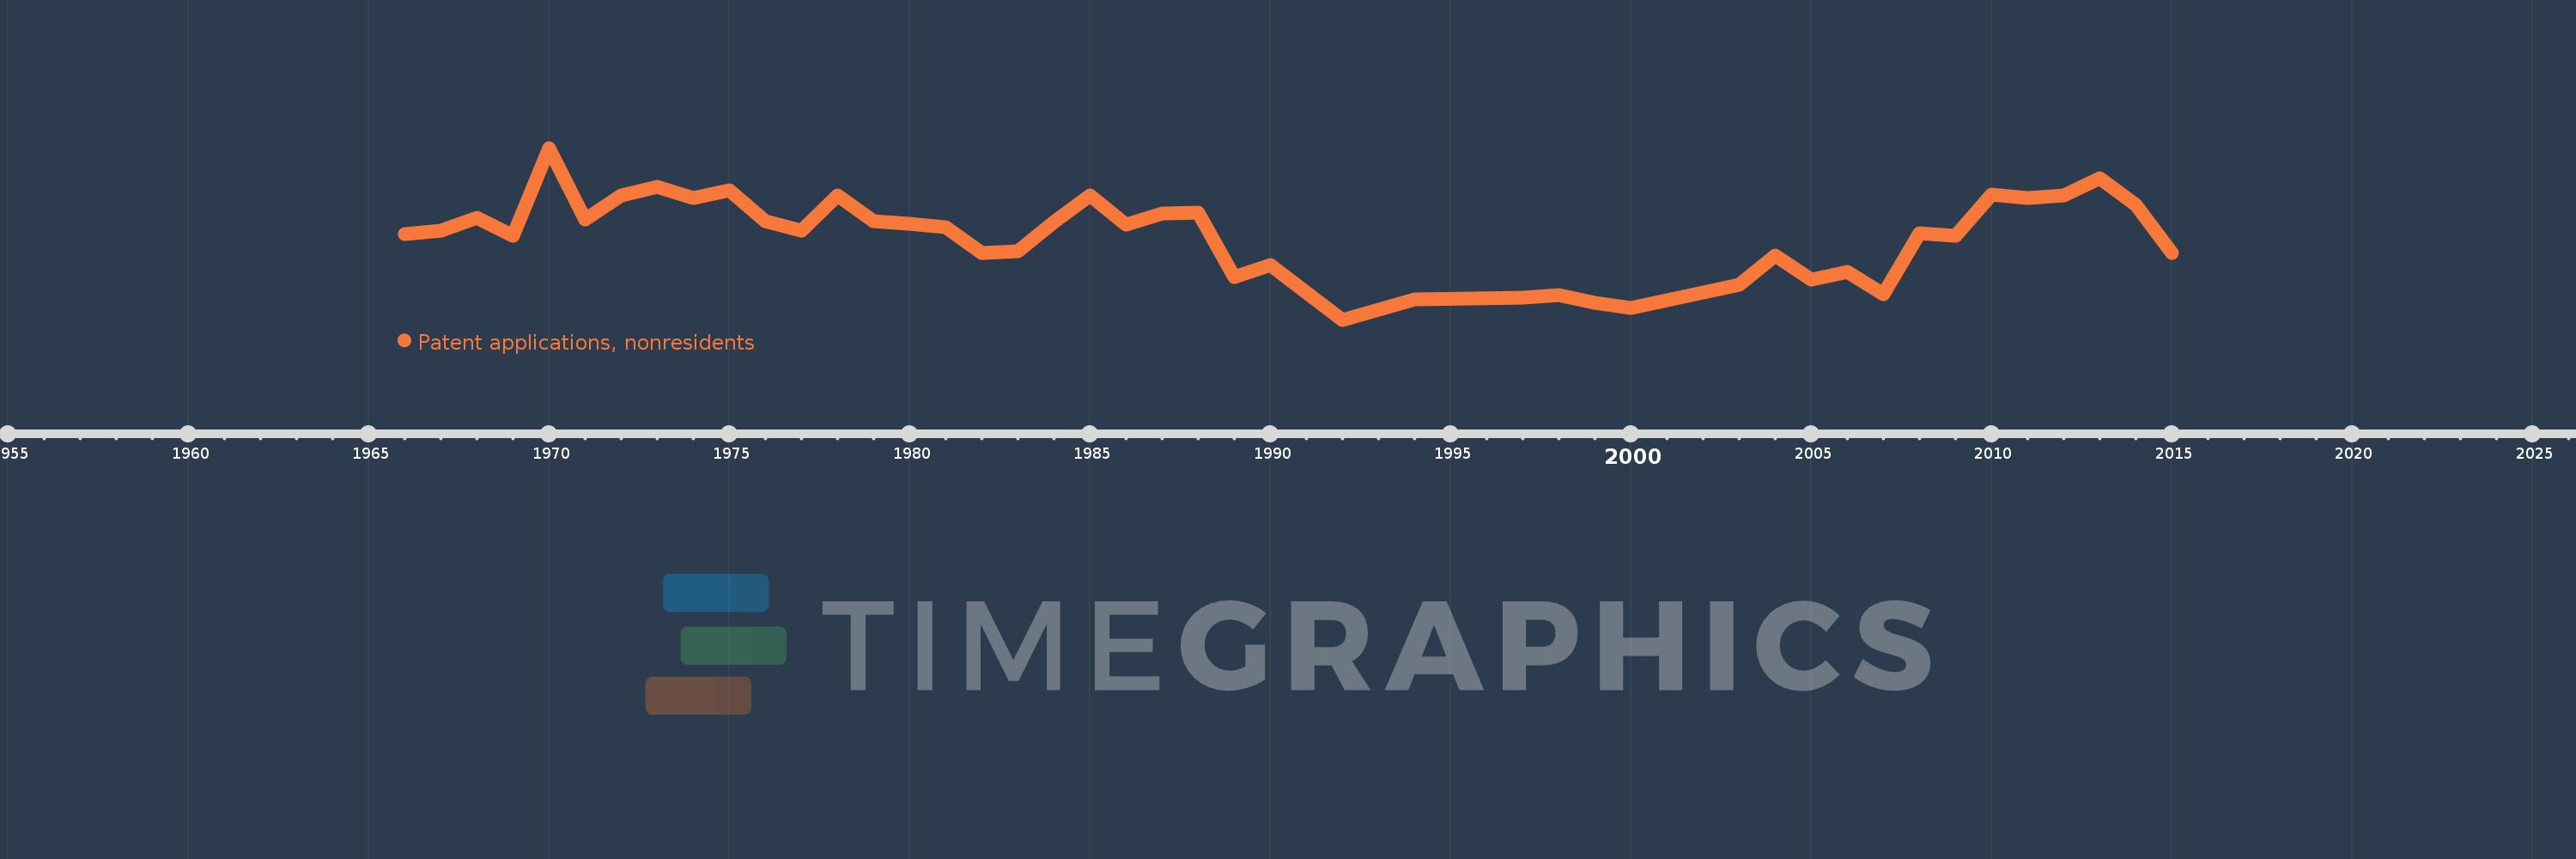
Patent applications, nonresidents
2015,2014,2013,2012,2011,2010,2009,2008,2007,2006,2005,2004,2003,2000,1999,1998,1997,1994,1992,1990,1989,1988,1987,1986,1985,1984,1983,1982,1981,1980,1979,1978,1977,1976,1975,1974,1973,1972,1971,1970,1969,1968,1967,1966
Estas estatísticas em outros países:
AlbaniaAlgeriaAngolaAntigua and BarbudaArab WorldArgentinaArmeniaAustraliaAustriaAzerbaijanBahamas, TheBahrainBangladeshBarbadosBelarusBelgiumBelizeBhutanBoliviaBosnia and HerzegovinaBotswanaBrazilBrunei DarussalamBulgariaBurundiCambodiaCanadaCaribbean small statesCentral Europe and the BalticsChileChinaColombiaCongo, Dem. Rep.Congo, Rep.Costa RicaCote d'IvoireCroatiaCubaCyprusCzech RepublicDenmarkDjiboutiDominicaDominican RepublicEarly-demographic dividendEast Asia & PacificEast Asia & Pacific (excluding high income)East Asia & Pacific (IDA & IBRD countries)EcuadorEgypt, Arab Rep.El SalvadorEstoniaEthiopiaEuro areaEurope & Central AsiaEurope & Central Asia (excluding high income)Europe & Central Asia (IDA & IBRD countries)European UnionFijiFinlandFranceGambia, TheGeorgiaGermanyGhanaGreeceGrenadaGuatemalaGuyanaHaitiHigh incomeHondurasHong Kong SAR, ChinaHungaryIBRD onlyIcelandIDA & IBRD totalIDA blendIndiaIndonesiaIran, Islamic Rep.IraqIrelandIsraelItalyJamaicaJapanJordanKazakhstanKenyaKiribatiKorea, Dem. People’s Rep.Korea, Rep.KuwaitKyrgyz RepublicLao PDRLate-demographic dividendLatin America & Caribbean Latin America & Caribbean (excluding high income)Latin America & the Caribbean (IDA & IBRD countries)LatviaLebanonLesothoLiberiaLibyaLithuaniaLow & middle incomeLower middle incomeLuxembourgMacao SAR, ChinaMacedonia, FYRMadagascarMalawiMalaysiaMaliMaltaMauritiusMexicoMiddle East & North AfricaMiddle East & North Africa (excluding high income)Middle East & North Africa (IDA & IBRD countries)Middle incomeMoldovaMonacoMongoliaMontenegroMoroccoMozambiqueNamibiaNepalNetherlandsNew ZealandNicaraguaNigeriaNorth AmericaNorwayOECD membersPacific island small statesPakistanPanamaPapua New GuineaParaguayPeruPhilippinesPolandPortugalPost-demographic dividendQatarRomaniaRussian FederationRwandaSamoaSao Tome and PrincipeSaudi ArabiaSerbiaSeychellesSierra LeoneSingaporeSlovak RepublicSloveniaSolomon IslandsSomaliaSouth AfricaSouth AsiaSouth Asia (IDA & IBRD)SpainSri LankaSt. LuciaSt. Vincent and the GrenadinesSudanSwazilandSwedenSwitzerlandSyrian Arab RepublicTajikistanTanzaniaThailandTrinidad and TobagoTunisiaTurkeyTurkmenistanUgandaUkraineUnited Arab EmiratesUnited KingdomUnited StatesUpper middle incomeUruguayUzbekistanVenezuela, RBVietnamWorldYemen, Rep.ZambiaZimbabwe Linha do tempo:
Nesta escala de tempo está apresentado um gráfico de 1966 ano até 2015 ano Kenya. Dados de 1965 ano ausente. O número de observações reais por data: 44.
Fonte (nome):
Indicadores de desenvolvimento mundial
Fonte (organização):
World Intellectual Property Organization (WIPO), WIPO Patent Report: Statistics on Worldwide Patent Activity. The International Bureau of WIPO assumes no responsibility with respect to the transformation of these data.
Categorias:
Science & Technology
Foi atualizado:
23 abr 2017 ano
Indicadores de alterações dos valores ao longo dos anos
Mínimo:
20.0
1 jan 1992 ano
Máximo:
161.0
1 jan 1970 ano
Na data de observação
Valor
Mudança absoluta
A alteração em relação ao valor anterior
1 jan 1966 ano
90.0
+90.0
0.0%
1 jan 1967 ano
93.0
+3.0
3.33%
1 jan 1968 ano
104.0
+11.0
11.83%
1 jan 1969 ano
89.0
-15.0
-14.42%
1 jan 1970 ano
161.0
+72.0
80.9%
1 jan 1971 ano
102.0
-59.0
-36.65%
1 jan 1972 ano
122.0
+20.0
19.61%
1 jan 1973 ano
129.0
+7.0
5.74%
1 jan 1974 ano
120.0
-9.0
-6.98%
1 jan 1975 ano
126.0
+6.0
5.0%
1 jan 1976 ano
101.0
-25.0
-19.84%
1 jan 1977 ano
93.0
-8.0
-7.92%
1 jan 1978 ano
122.0
+29.0
31.18%
1 jan 1979 ano
101.0
-21.0
-17.21%
1 jan 1980 ano
99.0
-2.0
-1.98%
1 jan 1981 ano
96.0
-3.0
-3.03%
1 jan 1982 ano
75.0
-21.0
-21.88%
1 jan 1983 ano
76.0
+1.0
1.33%
1 jan 1984 ano
100.0
+24.0
31.58%
1 jan 1985 ano
122.0
+22.0
22.0%
1 jan 1986 ano
98.0
-24.0
-19.67%
1 jan 1987 ano
107.0
+9.0
9.18%
1 jan 1988 ano
108.0
+1.0
0.93%
1 jan 1989 ano
55.0
-53.0
-49.07%
1 jan 1990 ano
65.0
+10.0
18.18%
1 jan 1992 ano
20.0
-45.0
-69.23%
1 jan 1994 ano
37.0
+17.0
85.0%
1 jan 1997 ano
38.0
+1.0
2.7%
1 jan 1998 ano
40.0
+2.0
5.26%
1 jan 1999 ano
34.0
-6.0
-15.0%
1 jan 2000 ano
30.0
-4.0
-11.76%
1 jan 2003 ano
49.0
+19.0
63.33%
1 jan 2004 ano
73.0
+24.0
48.98%
1 jan 2005 ano
53.0
-20.0
-27.4%
1 jan 2006 ano
59.0
+6.0
11.32%
1 jan 2007 ano
41.0
-18.0
-30.51%
1 jan 2008 ano
91.0
+50.0
121.95%
1 jan 2009 ano
89.0
-2.0
-2.2%
1 jan 2010 ano
123.0
+34.0
38.2%
1 jan 2011 ano
120.0
-3.0
-2.44%
1 jan 2012 ano
122.0
+2.0
1.67%
1 jan 2013 ano
136.0
+14.0
11.48%
1 jan 2014 ano
114.0
-22.0
-16.18%
1 jan 2015 ano
75.0
-39.0
-34.21%
Classificação de países por estatísticas atuais por anos


Comentários: