29
/pt/
pt
AIzaSyAYiBZKx7MnpbEhh9jyipgxe19OcubqV5w
April 1, 2024
161433
Italy
ITA
true
2
1
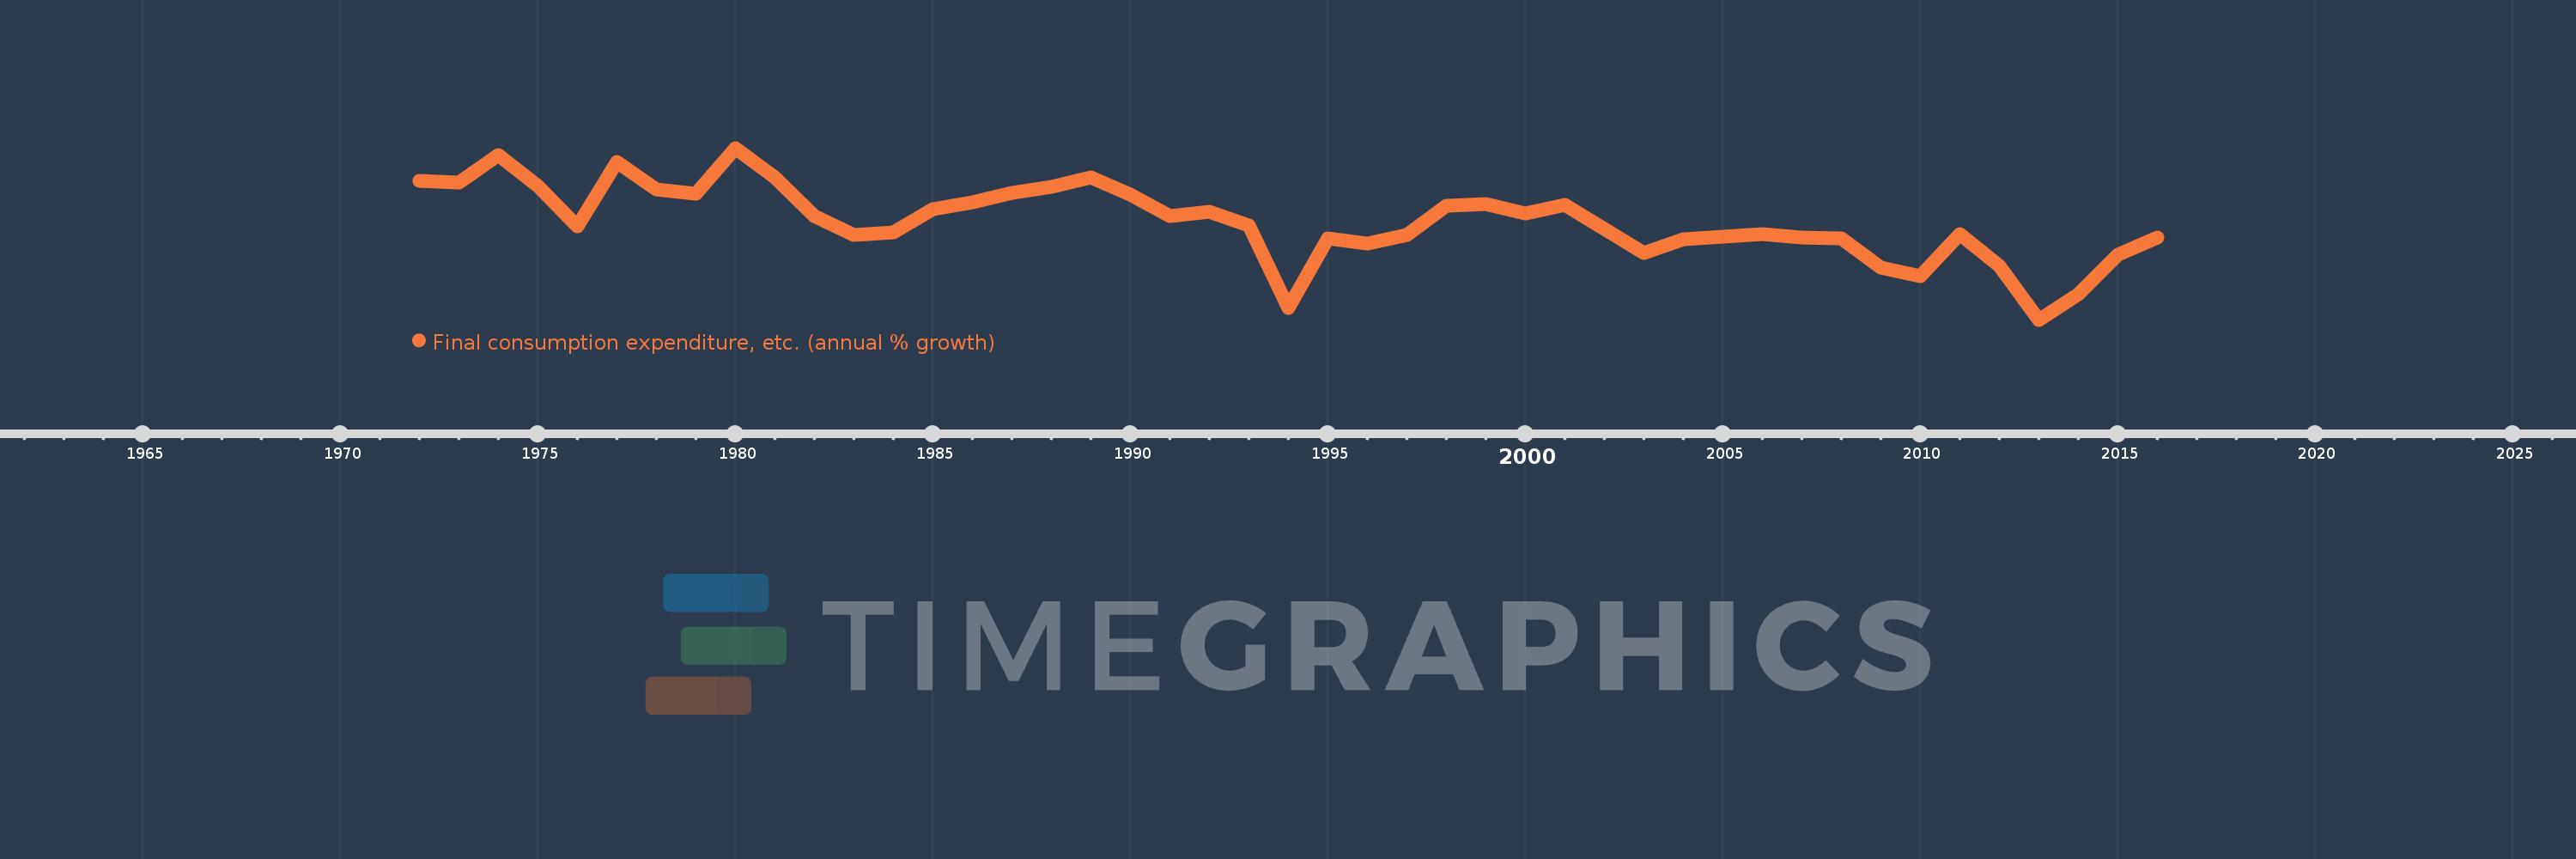
Final consumption expenditure, etc. (annual % growth)
2016,2015,2014,2013,2012,2011,2010,2009,2008,2007,2006,2005,2004,2003,2002,2001,2000,1999,1998,1997,1996,1995,1994,1993,1992,1991,1990,1989,1988,1987,1986,1985,1984,1983,1982,1981,1980,1979,1978,1977,1976,1975,1974,1973,1972
Estas estatísticas em outros países:
AlbaniaAlgeriaAntigua and BarbudaArab WorldArgentinaArmeniaAustraliaAustriaAzerbaijanBahamas, TheBahrainBangladeshBarbadosBelarusBelgiumBelizeBeninBhutanBoliviaBosnia and HerzegovinaBotswanaBrazilBrunei DarussalamBulgariaBurkina FasoBurundiCabo VerdeCambodiaCameroonCanadaCaribbean small statesCentral Europe and the BalticsChadChileColombiaComorosCongo, Dem. Rep.Congo, Rep.Costa RicaCote d'IvoireCroatiaCubaCyprusCzech RepublicDenmarkDjiboutiDominican RepublicEarly-demographic dividendEast Asia & PacificEcuadorEgypt, Arab Rep.El SalvadorEquatorial GuineaEritreaEstoniaEthiopiaEuro areaEurope & Central AsiaEurope & Central Asia (excluding high income)Europe & Central Asia (IDA & IBRD countries)European UnionFijiFinlandFranceGabonGambia, TheGeorgiaGermanyGhanaGreeceGuatemalaGuineaGuinea-BissauHaitiHeavily indebted poor countries (HIPC)High incomeHondurasHong Kong SAR, ChinaHungaryIBRD onlyIcelandIDA & IBRD totalIDA blendIDA onlyIDA totalIndiaIndonesiaIran, Islamic Rep.IrelandIsraelItalyJamaicaJapanJordanKazakhstanKenyaKorea, Rep.KosovoKuwaitKyrgyz RepublicLao PDRLatin America & Caribbean Latin America & Caribbean (excluding high income)Latin America & the Caribbean (IDA & IBRD countries)LatviaLeast developed countries: UN classificationLebanonLiberiaLithuaniaLow & middle incomeLow incomeLower middle incomeLuxembourgMacao SAR, ChinaMacedonia, FYRMadagascarMalawiMalaysiaMaliMaltaMauritaniaMauritiusMexicoMiddle East & North AfricaMiddle East & North Africa (excluding high income)Middle East & North Africa (IDA & IBRD countries)Middle incomeMoldovaMongoliaMontenegroMoroccoMozambiqueNamibiaNepalNetherlandsNew ZealandNicaraguaNigerNigeriaNorth AmericaNorwayOECD membersOmanOther small statesPakistanPanamaPapua New GuineaParaguayPeruPhilippinesPolandPortugalPost-demographic dividendPre-demographic dividendPuerto RicoQatarRomaniaRussian FederationRwandaSaudi ArabiaSenegalSerbiaSeychellesSierra LeoneSingaporeSlovak RepublicSloveniaSmall statesSomaliaSouth AfricaSouth AsiaSouth Asia (IDA & IBRD)South SudanSpainSri LankaSub-Saharan Africa Sub-Saharan Africa (excluding high income)Sub-Saharan Africa (IDA & IBRD countries)SudanSurinameSwazilandSwedenSwitzerlandSyrian Arab RepublicTajikistanTanzaniaThailandTimor-LesteTogoTrinidad and TobagoTunisiaTurkeyTurkmenistanUgandaUkraineUnited Arab EmiratesUnited KingdomUnited StatesUpper middle incomeUruguayUzbekistanVanuatuVenezuela, RBVietnamWest Bank and GazaWorldZimbabwe Linha do tempo:
Nesta escala de tempo está apresentado um gráfico de 1972 ano até 2016 ano Italy. Dados de 1971 ano ausente. O número de observações reais por data: 45.
Fonte (nome):
Indicadores de desenvolvimento mundial
Fonte (organização):
World Bank national accounts data, and OECD National Accounts data files.
Categorias:
Economy & Growth
Foi atualizado:
23 abr 2017 ano
Indicadores de alterações dos valores ao longo dos anos
Mínimo:
-3.233
1 jan 2013 ano
Máximo:
5.609
1 jan 1980 ano
Na data de observação
Valor
Mudança absoluta
A alteração em relação ao valor anterior
1 jan 1972 ano
3.904
+3.904
0.0%
1 jan 1973 ano
3.837
-0.067
-1.72%
1 jan 1974 ano
5.243
+1.406
36.64%
1 jan 1975 ano
3.666
-1.577
-30.07%
1 jan 1976 ano
1.573
-2.094
-57.1%
1 jan 1977 ano
4.9
+3.327
211.53%
1 jan 1978 ano
3.474
-1.426
-29.1%
1 jan 1979 ano
3.273
-0.201
-5.78%
1 jan 1980 ano
5.609
+2.336
71.37%
1 jan 1981 ano
4.077
-1.532
-27.32%
1 jan 1982 ano
2.086
-1.991
-48.84%
1 jan 1983 ano
1.135
-0.95
-45.57%
1 jan 1984 ano
1.242
+0.107
9.45%
1 jan 1985 ano
2.441
+1.199
96.49%
1 jan 1986 ano
2.794
+0.353
14.45%
1 jan 1987 ano
3.312
+0.518
18.54%
1 jan 1988 ano
3.606
+0.294
8.87%
1 jan 1989 ano
4.072
+0.466
12.91%
1 jan 1990 ano
3.189
-0.882
-21.67%
1 jan 1991 ano
2.084
-1.105
-34.64%
1 jan 1992 ano
2.306
+0.222
10.65%
1 jan 1993 ano
1.619
-0.688
-29.81%
1 jan 1994 ano
-2.619
-4.237
-261.76%
1 jan 1995 ano
0.966
+3.585
-136.89%
1 jan 1996 ano
0.706
-0.26
-26.89%
1 jan 1997 ano
1.116
+0.41
58.09%
1 jan 1998 ano
2.633
+1.516
135.81%
1 jan 1999 ano
2.705
+0.072
2.75%
1 jan 2000 ano
2.222
-0.484
-17.87%
1 jan 2001 ano
2.69
+0.469
21.1%
1 jan 2002 ano
1.459
-1.232
-45.78%
1 jan 2003 ano
0.205
-1.253
-85.92%
1 jan 2004 ano
0.91
+0.704
342.95%
1 jan 2005 ano
1.049
+0.139
15.32%
1 jan 2006 ano
1.178
+0.129
12.31%
1 jan 2007 ano
1.011
-0.167
-14.14%
1 jan 2008 ano
0.942
-0.069
-6.87%
1 jan 2009 ano
-0.567
-1.508
-160.15%
1 jan 2010 ano
-0.977
-0.411
72.5%
1 jan 2011 ano
1.16
+2.137
-218.64%
1 jan 2012 ano
-0.465
-1.624
-140.07%
1 jan 2013 ano
-3.233
-2.769
595.87%
1 jan 2014 ano
-1.909
+1.324
-40.96%
1 jan 2015 ano
0.095
+2.004
-104.97%
1 jan 2016 ano
1.005
+0.91
959.27%
Classificação de países por estatísticas atuais por anos


Comentários: