29
/pt/
pt
AIzaSyAYiBZKx7MnpbEhh9jyipgxe19OcubqV5w
April 1, 2024
158062
Iran, Islamic Rep.
IRN
true
2
1
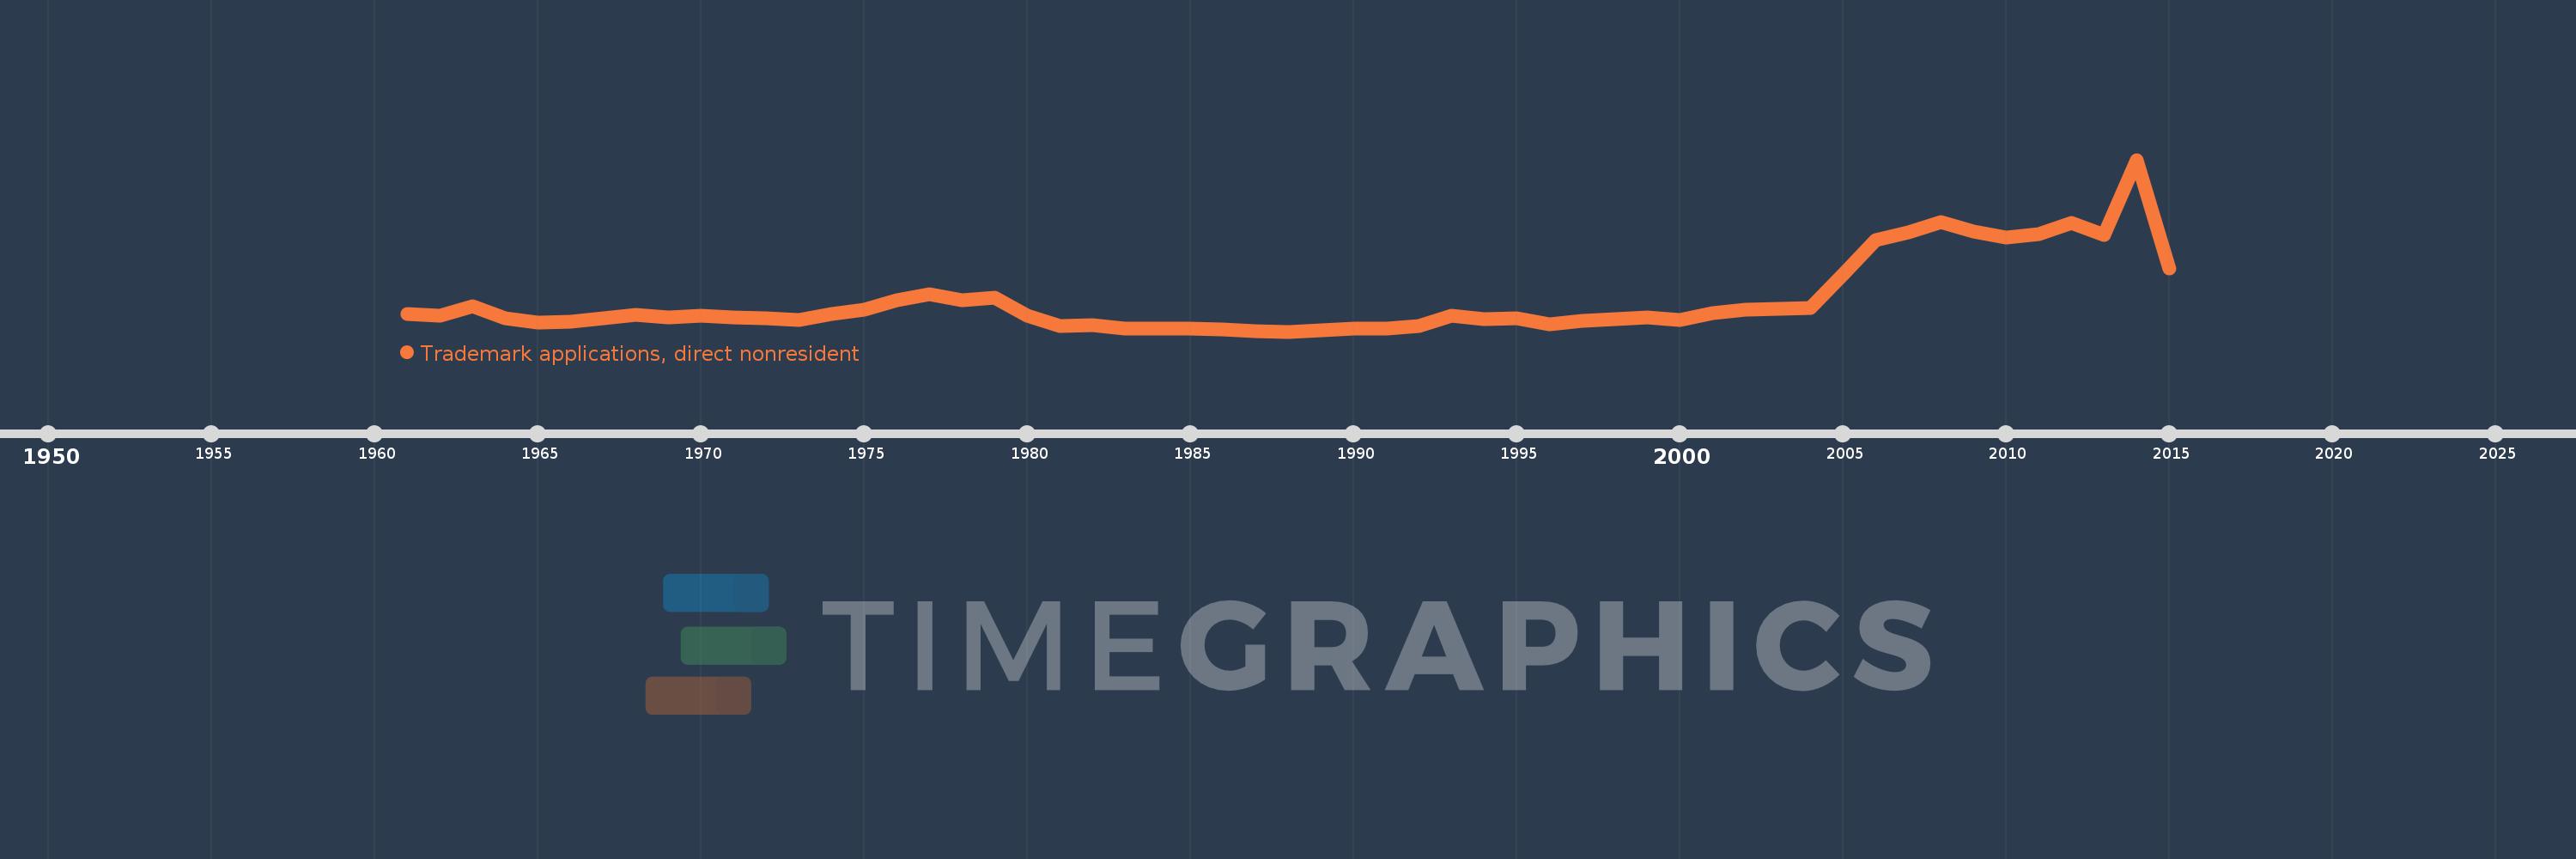
Trademark applications, direct nonresident
2015,2014,2013,2012,2011,2010,2009,2008,2007,2006,2005,2004,2003,2002,2001,2000,1999,1998,1997,1996,1995,1994,1993,1992,1991,1990,1989,1988,1987,1986,1985,1984,1983,1982,1981,1980,1979,1978,1977,1976,1975,1974,1973,1972,1971,1970,1969,1968,1967,1966,1965,1964,1963,1962,1961
Estas estatísticas em outros países:
AlbaniaAlgeriaAndorraAngolaAntigua and BarbudaArab WorldArgentinaArmeniaArubaAustraliaAustriaAzerbaijanBahamas, TheBahrainBangladeshBarbadosBelarusBelgiumBelizeBhutanBoliviaBosnia and HerzegovinaBotswanaBrazilBrunei DarussalamBulgariaBurundiCambodiaCanadaCaribbean small statesCentral Europe and the BalticsChileChinaColombiaCongo, Dem. Rep.Costa RicaCroatiaCubaCuracaoCyprusCzech RepublicDenmarkDjiboutiDominicaDominican RepublicEarly-demographic dividendEast Asia & PacificEast Asia & Pacific (excluding high income)East Asia & Pacific (IDA & IBRD countries)EcuadorEgypt, Arab Rep.El SalvadorEstoniaEthiopiaEuro areaEurope & Central AsiaEurope & Central Asia (excluding high income)Europe & Central Asia (IDA & IBRD countries)European UnionFijiFinlandFranceGambia, TheGeorgiaGermanyGhanaGreeceGrenadaGuatemalaGuyanaHaitiHigh incomeHondurasHong Kong SAR, ChinaHungaryIBRD onlyIcelandIDA & IBRD totalIDA blendIndiaIndonesiaIran, Islamic Rep.IraqIrelandIsraelItalyJamaicaJapanJordanKazakhstanKenyaKiribatiKorea, Dem. People’s Rep.Korea, Rep.KuwaitKyrgyz RepublicLao PDRLate-demographic dividendLatin America & Caribbean Latin America & Caribbean (excluding high income)Latin America & the Caribbean (IDA & IBRD countries)LatviaLebanonLesothoLiberiaLibyaLiechtensteinLithuaniaLow & middle incomeLower middle incomeLuxembourgMacao SAR, ChinaMacedonia, FYRMadagascarMalawiMalaysiaMaliMaltaMauritiusMexicoMiddle East & North AfricaMiddle East & North Africa (excluding high income)Middle East & North Africa (IDA & IBRD countries)Middle incomeMoldovaMonacoMongoliaMontenegroMoroccoMozambiqueMyanmarNamibiaNepalNetherlandsNew ZealandNicaraguaNigeriaNorth AmericaNorwayOECD membersOmanOther small statesPacific island small statesPakistanPanamaPapua New GuineaParaguayPeruPhilippinesPolandPortugalPost-demographic dividendQatarRomaniaRussian FederationRwandaSamoaSan MarinoSao Tome and PrincipeSaudi ArabiaSerbiaSeychellesSierra LeoneSingaporeSint Maarten (Dutch part)Slovak RepublicSloveniaSmall statesSolomon IslandsSomaliaSouth AfricaSouth AsiaSouth Asia (IDA & IBRD)SpainSri LankaSt. LuciaSt. Vincent and the GrenadinesSudanSurinameSwazilandSwedenSwitzerlandSyrian Arab RepublicTajikistanTanzaniaThailandTongaTrinidad and TobagoTunisiaTurkeyTurkmenistanTuvaluUgandaUkraineUnited Arab EmiratesUnited KingdomUnited StatesUpper middle incomeUruguayUzbekistanVenezuela, RBVietnamWorldYemen, Rep.ZambiaZimbabwe Linha do tempo:
Nesta escala de tempo está apresentado um gráfico de 1961 ano até 2015 ano Iran, Islamic Rep.. Dados de 1960 ano ausente. O número de observações reais por data: 55.
Fonte (nome):
Indicadores de desenvolvimento mundial
Fonte (organização):
World Intellectual Property Organization (WIPO), WIPO Patent Report: Statistics on Worldwide Patent Activity. The International Bureau of WIPO assumes no responsibility with respect to the transformation of these data.
Categorias:
Science & Technology
Foi atualizado:
23 abr 2017 ano
Indicadores de alterações dos valores ao longo dos anos
Mínimo:
253.0
1 jan 1988 ano
Máximo:
7.784 mil
1 jan 2014 ano
Na data de observação
Valor
Mudança absoluta
A alteração em relação ao valor anterior
1 jan 1961 ano
1.02 mil
+1.02 mil
0.0%
1 jan 1962 ano
949.0
-71.0
-6.96%
1 jan 1963 ano
1.348 mil
+399.0
42.04%
1 jan 1964 ano
850.0
-498.0
-36.94%
1 jan 1965 ano
631.0
-219.0
-25.76%
1 jan 1966 ano
685.0
+54.0
8.56%
1 jan 1967 ano
837.0
+152.0
22.19%
1 jan 1968 ano
980.0
+143.0
17.08%
1 jan 1969 ano
880.0
-100.0
-10.2%
1 jan 1970 ano
961.0
+81.0
9.2%
1 jan 1971 ano
874.0
-87.0
-9.05%
1 jan 1972 ano
853.0
-21.0
-2.4%
1 jan 1973 ano
776.0
-77.0
-9.03%
1 jan 1974 ano
1.028 mil
+252.0
32.47%
1 jan 1975 ano
1.22 mil
+192.0
18.68%
1 jan 1976 ano
1.644 mil
+424.0
34.75%
1 jan 1977 ano
1.878 mil
+234.0
14.23%
1 jan 1978 ano
1.616 mil
-262.0
-13.95%
1 jan 1979 ano
1.749 mil
+133.0
8.23%
1 jan 1980 ano
932.0
-817.0
-46.71%
1 jan 1981 ano
500.0
-432.0
-46.35%
1 jan 1982 ano
523.0
+23.0
4.6%
1 jan 1983 ano
386.0
-137.0
-26.2%
1 jan 1984 ano
374.0
-12.0
-3.11%
1 jan 1985 ano
391.0
+17.0
4.55%
1 jan 1986 ano
355.0
-36.0
-9.21%
1 jan 1987 ano
290.0
-65.0
-18.31%
1 jan 1988 ano
253.0
-37.0
-12.76%
1 jan 1989 ano
318.0
+65.0
25.69%
1 jan 1990 ano
374.0
+56.0
17.61%
1 jan 1991 ano
398.0
+24.0
6.42%
1 jan 1992 ano
510.0
+112.0
28.14%
1 jan 1993 ano
954.0
+444.0
87.06%
1 jan 1994 ano
797.0
-157.0
-16.46%
1 jan 1995 ano
829.0
+32.0
4.02%
1 jan 1996 ano
566.0
-263.0
-31.72%
1 jan 1997 ano
711.0
+145.0
25.62%
1 jan 1998 ano
795.0
+84.0
11.81%
1 jan 1999 ano
861.0
+66.0
8.3%
1 jan 2000 ano
771.0
-90.0
-10.45%
1 jan 2001 ano
1.047 mil
+276.0
35.8%
1 jan 2002 ano
1.224 mil
+177.0
16.91%
1 jan 2003 ano
1.239 mil
+15.0
1.23%
1 jan 2004 ano
1.28 mil
+41.0
3.31%
1 jan 2005 ano
2.748 mil
+1.468 mil
114.69%
1 jan 2006 ano
4.255 mil
+1.507 mil
54.84%
1 jan 2007 ano
4.591 mil
+336.0
7.9%
1 jan 2008 ano
5.061 mil
+470.0
10.24%
1 jan 2009 ano
4.641 mil
-420.0
-8.3%
1 jan 2010 ano
4.37 mil
-271.0
-5.84%
1 jan 2011 ano
4.539 mil
+169.0
3.87%
1 jan 2012 ano
5.022 mil
+483.0
10.64%
1 jan 2013 ano
4.486 mil
-536.0
-10.67%
1 jan 2014 ano
7.784 mil
+3.298 mil
73.52%
1 jan 2015 ano
3.027 mil
-4.757 mil
-61.11%
Classificação de países por estatísticas atuais por anos


Comentários: