29
/pt/
pt
AIzaSyAYiBZKx7MnpbEhh9jyipgxe19OcubqV5w
April 1, 2024
158015
Iran, Islamic Rep.
IRN
true
2
1
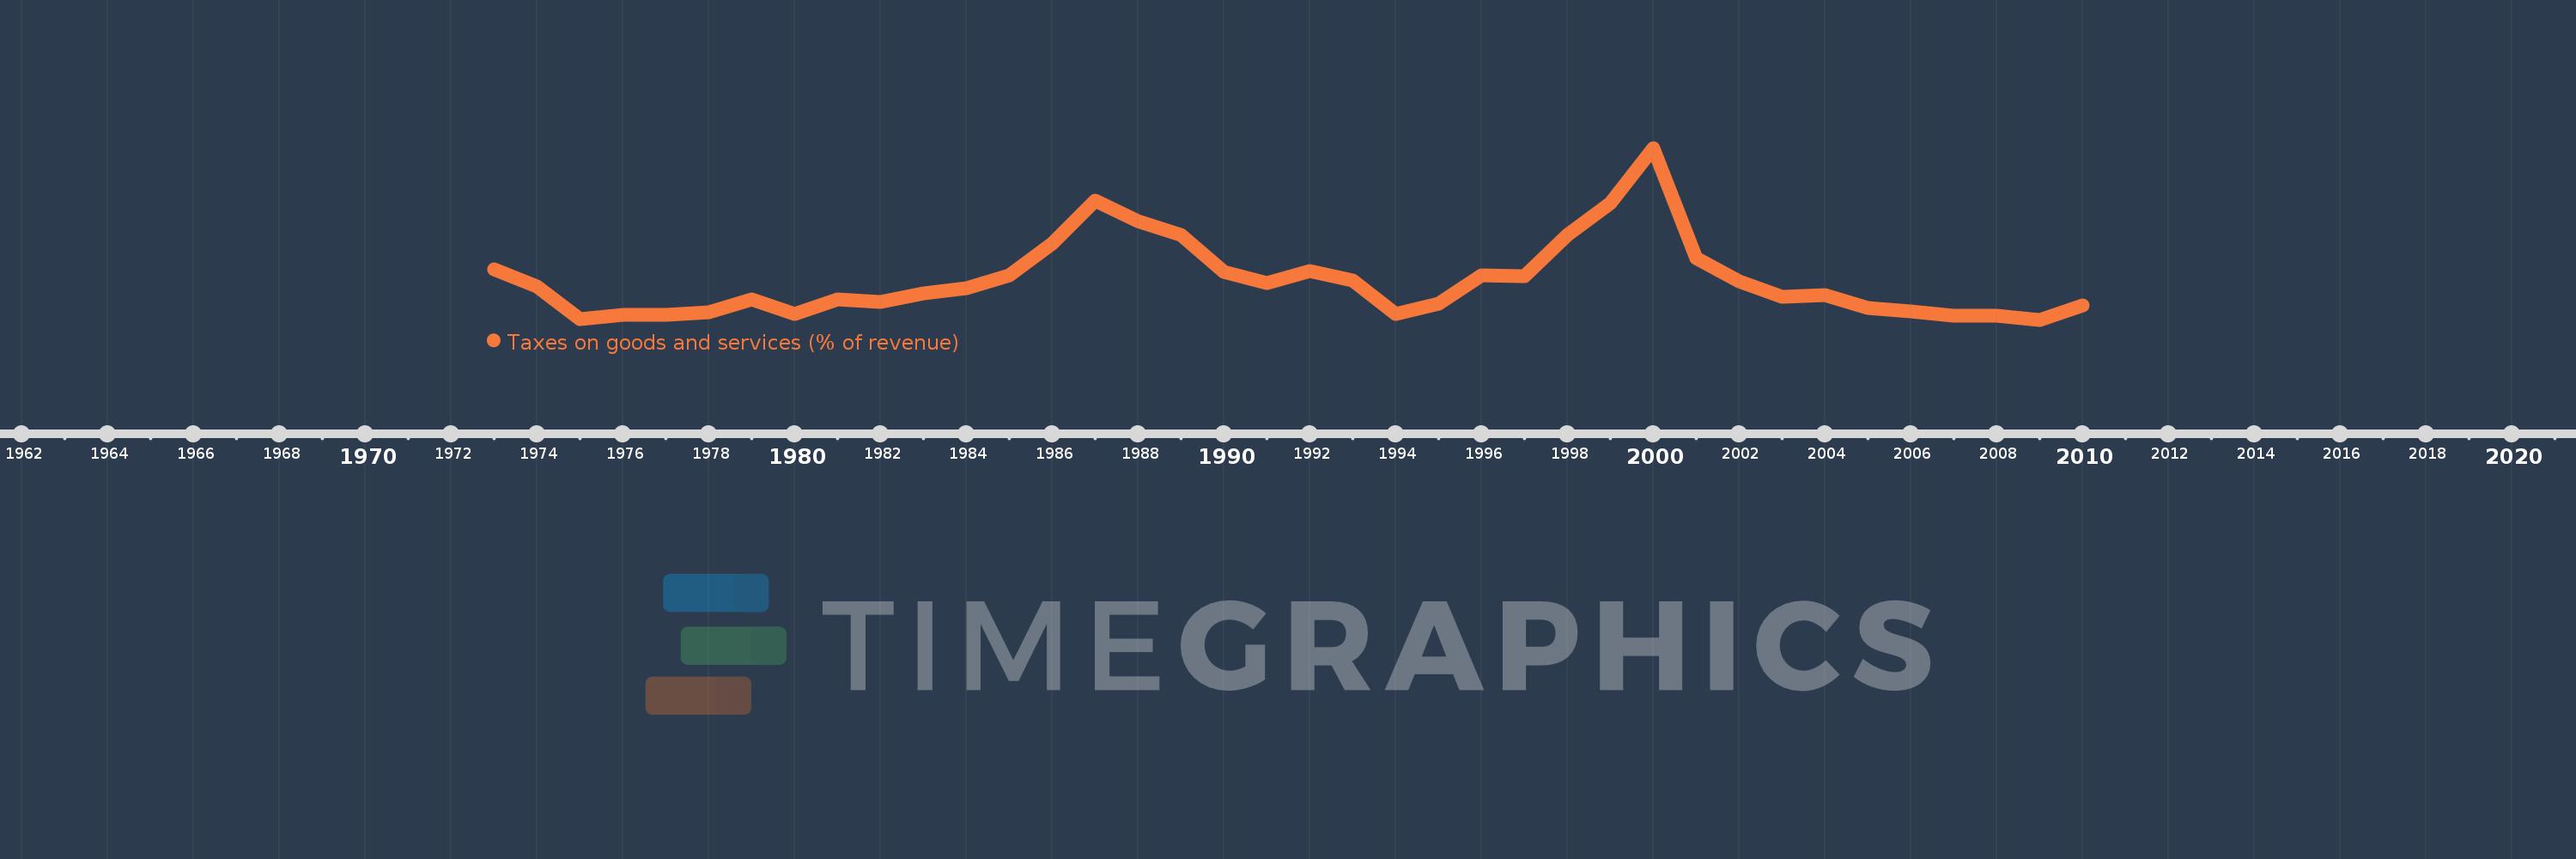
Taxes on goods and services (% of revenue)
2010,2009,2008,2007,2006,2005,2004,2003,2002,2001,2000,1999,1998,1997,1996,1995,1994,1993,1992,1991,1990,1989,1988,1987,1986,1985,1984,1983,1982,1981,1980,1979,1978,1977,1976,1975,1974,1973
Estas estatísticas em outros países:
AfghanistanAlbaniaAlgeriaAngolaAntigua and BarbudaArab WorldArgentinaArmeniaAustraliaAustriaAzerbaijanBahamas, TheBahrainBangladeshBarbadosBelarusBelgiumBelizeBeninBhutanBoliviaBosnia and HerzegovinaBotswanaBrazilBulgariaBurkina FasoBurundiCabo VerdeCambodiaCanadaCaribbean small statesCentral African RepublicCentral Europe and the BalticsChileChinaColombiaCongo, Dem. Rep.Congo, Rep.Costa RicaCote d'IvoireCroatiaCyprusCzech RepublicDenmarkDominicaDominican RepublicEarly-demographic dividendEast Asia & PacificEast Asia & Pacific (excluding high income)East Asia & Pacific (IDA & IBRD countries)Egypt, Arab Rep.El SalvadorEquatorial GuineaEstoniaEthiopiaEuro areaEurope & Central AsiaEurope & Central Asia (excluding high income)Europe & Central Asia (IDA & IBRD countries)European UnionFijiFinlandFranceGambia, TheGeorgiaGermanyGhanaGreeceGrenadaGuatemalaHeavily indebted poor countries (HIPC)High incomeHondurasHong Kong SAR, ChinaHungaryIBRD onlyIcelandIDA & IBRD totalIDA blendIDA onlyIDA totalIndiaIndonesiaIran, Islamic Rep.IraqIrelandIsraelItalyJamaicaJapanJordanKazakhstanKenyaKiribatiKorea, Rep.KuwaitKyrgyz RepublicLao PDRLate-demographic dividendLatin America & Caribbean Latin America & Caribbean (excluding high income)Latin America & the Caribbean (IDA & IBRD countries)LatviaLeast developed countries: UN classificationLebanonLesothoLiberiaLithuaniaLow & middle incomeLow incomeLower middle incomeLuxembourgMacao SAR, ChinaMacedonia, FYRMadagascarMalawiMalaysiaMaldivesMaliMaltaMauritiusMexicoMicronesia, Fed. Sts.Middle East & North AfricaMiddle East & North Africa (excluding high income)Middle East & North Africa (IDA & IBRD countries)Middle incomeMoldovaMongoliaMoroccoMozambiqueMyanmarNamibiaNepalNetherlandsNew ZealandNicaraguaNigeriaNorth AmericaNorwayOECD membersOmanOther small statesPakistanPanamaPapua New GuineaParaguayPeruPhilippinesPolandPortugalPost-demographic dividendPre-demographic dividendRomaniaRussian FederationRwandaSamoaSan MarinoSao Tome and PrincipeSenegalSerbiaSeychellesSierra LeoneSingaporeSlovak RepublicSloveniaSmall statesSolomon IslandsSouth AfricaSouth AsiaSouth Asia (IDA & IBRD)SpainSri LankaSt. Kitts and NevisSt. LuciaSub-Saharan Africa Sub-Saharan Africa (excluding high income)Sub-Saharan Africa (IDA & IBRD countries)SurinameSwazilandSwedenSwitzerlandSyrian Arab RepublicTajikistanTanzaniaThailandTimor-LesteTogoTrinidad and TobagoTunisiaTurkeyUgandaUkraineUnited Arab EmiratesUnited KingdomUnited StatesUpper middle incomeUruguayVanuatuVenezuela, RBVietnamWest Bank and GazaWorldYemen, Rep.ZambiaZimbabwe Linha do tempo:
Nesta escala de tempo está apresentado um gráfico de 1973 ano até 2010 ano Iran, Islamic Rep.. Dados de 1972 ano ausente. O número de observações reais por data: 38.
Fonte (nome):
Indicadores de desenvolvimento mundial
Fonte (organização):
International Monetary Fund, Government Finance Statistics Yearbook and data files.
Categorias:
Public Sector
Foi atualizado:
23 abr 2017 ano
Indicadores de alterações dos valores ao longo dos anos
Máximo:
16.849
1 jan 2000 ano
Na data de observação
Valor
Mudança absoluta
A alteração em relação ao valor anterior
1 jan 1973 ano
6.553
+6.553
0.0%
1 jan 1974 ano
5.122
-1.43
-21.83%
1 jan 1975 ano
2.319
-2.803
-54.72%
1 jan 1976 ano
2.748
+0.428
18.47%
1 jan 1977 ano
2.696
-0.052
-1.9%
1 jan 1978 ano
2.905
+0.209
7.76%
1 jan 1979 ano
4.001
+1.096
37.74%
1 jan 1980 ano
2.819
-1.182
-29.53%
1 jan 1981 ano
4.028
+1.209
42.86%
1 jan 1982 ano
3.834
-0.194
-4.83%
1 jan 1983 ano
4.525
+0.692
18.04%
1 jan 1984 ano
4.957
+0.432
9.54%
1 jan 1985 ano
6.046
+1.089
21.97%
1 jan 1986 ano
8.756
+2.71
44.82%
1 jan 1987 ano
12.369
+3.613
41.26%
1 jan 1988 ano
10.636
-1.732
-14.01%
1 jan 1989 ano
9.48
-1.156
-10.87%
1 jan 1990 ano
6.36
-3.12
-32.91%
1 jan 1991 ano
5.415
-0.945
-14.87%
1 jan 1992 ano
6.419
+1.004
18.54%
1 jan 1993 ano
5.653
-0.765
-11.92%
1 jan 1994 ano
2.763
-2.89
-51.12%
1 jan 1995 ano
3.661
+0.897
32.47%
1 jan 1996 ano
6.031
+2.37
64.76%
1 jan 1997 ano
5.977
-0.054
-0.89%
1 jan 1998 ano
9.493
+3.516
58.83%
1 jan 1999 ano
12.18
+2.687
28.31%
1 jan 2000 ano
16.849
+4.669
38.33%
1 jan 2001 ano
7.503
-9.346
-55.47%
1 jan 2002 ano
5.57
-1.933
-25.76%
1 jan 2003 ano
4.267
-1.303
-23.39%
1 jan 2004 ano
4.36
+0.093
2.18%
1 jan 2005 ano
3.328
-1.032
-23.66%
1 jan 2006 ano
3.024
-0.304
-9.14%
1 jan 2007 ano
2.668
-0.356
-11.77%
1 jan 2008 ano
2.637
-0.032
-1.18%
1 jan 2009 ano
2.3
-0.337
-12.77%
1 jan 2010 ano
3.515
+1.215
52.83%
Classificação de países por estatísticas atuais por anos


Comentários: