29
/pt/
pt
AIzaSyAYiBZKx7MnpbEhh9jyipgxe19OcubqV5w
April 1, 2024
157210
Iran, Islamic Rep.
IRN
true
2
1
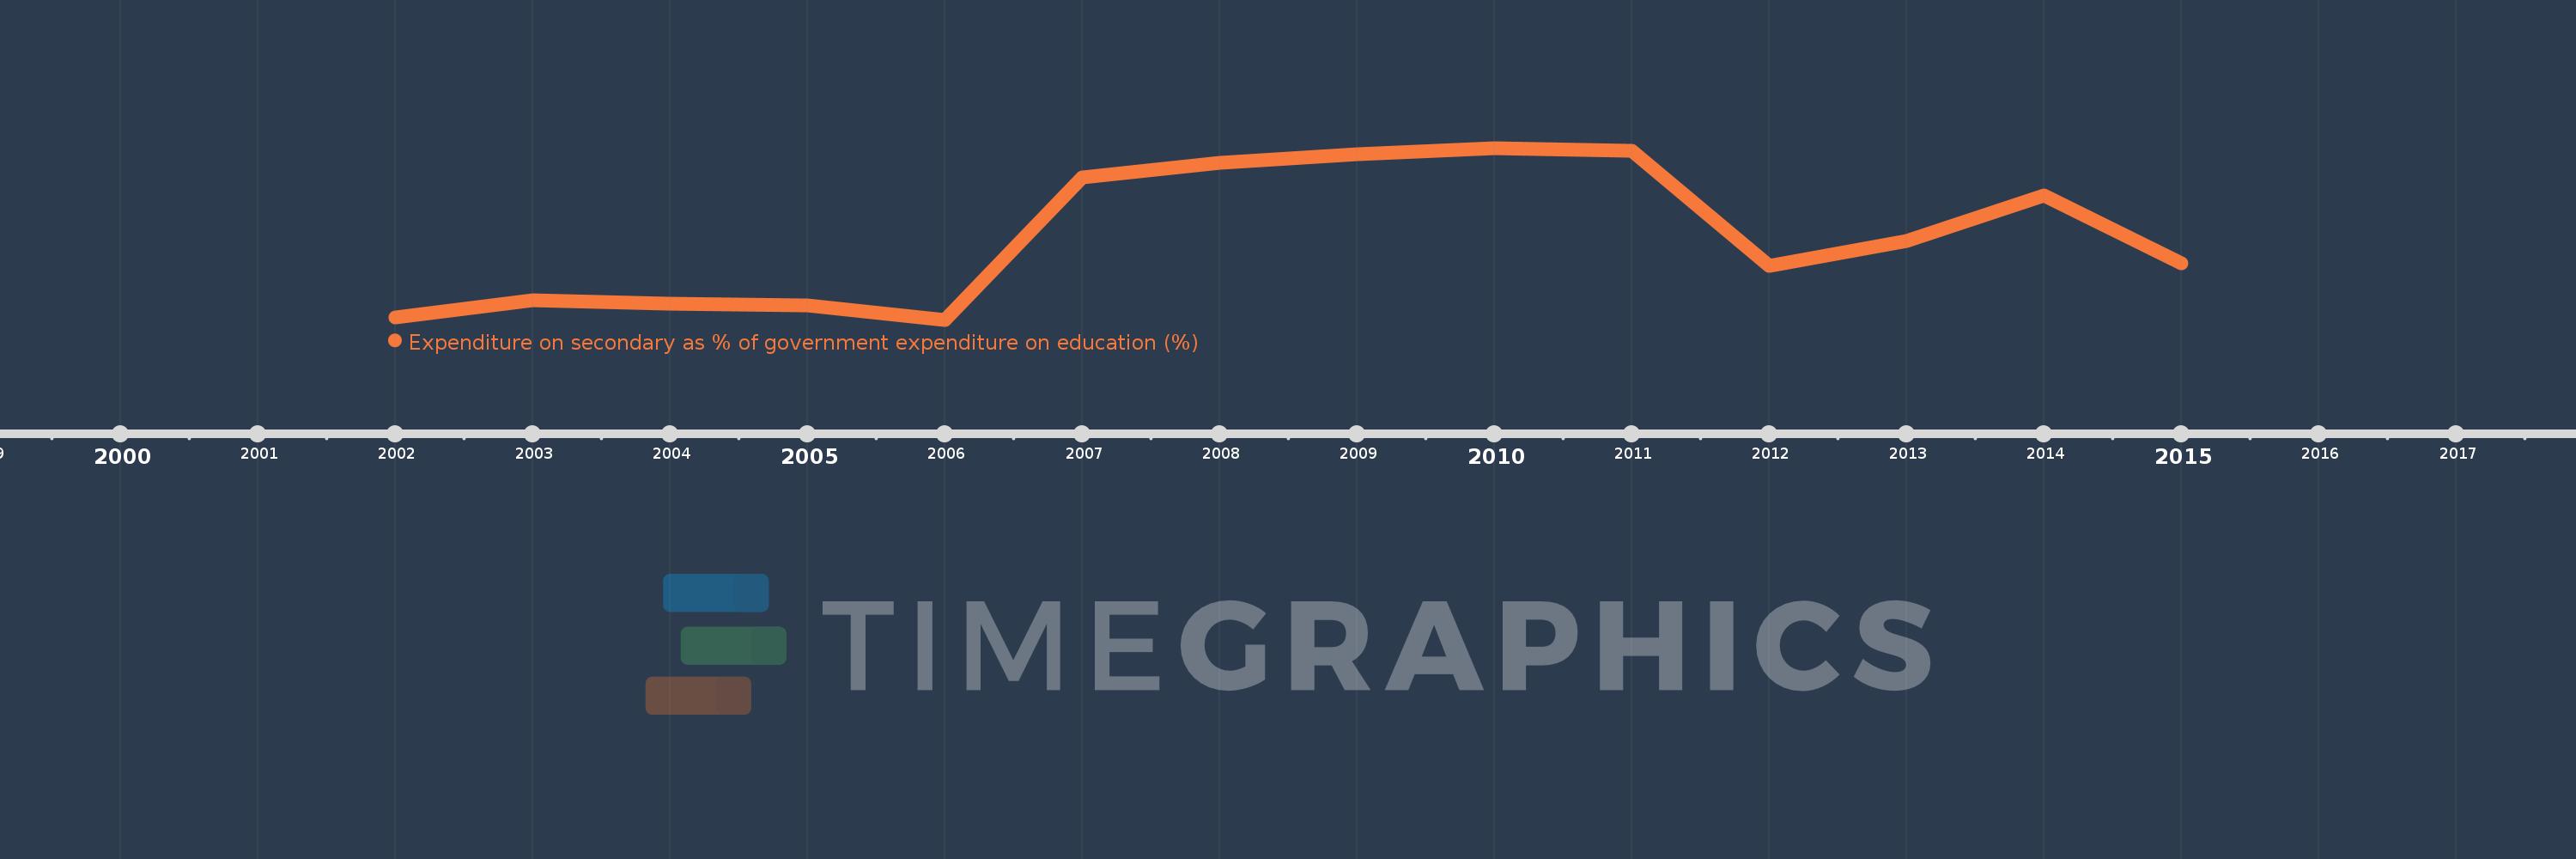
Expenditure on secondary as % of government expenditure on education (%)
2015,2014,2013,2012,2011,2010,2009,2008,2007,2006,2005,2004,2003,2002
Estas estatísticas em outros países:
Linha do tempo:
Nesta escala de tempo está apresentado um gráfico de 2002 ano até 2015 ano Iran, Islamic Rep.. Dados de 2001 ano ausente. O número de observações reais por data: 14.
Fonte (nome):
Indicadores de desenvolvimento mundial
Fonte (organização):
UNESCO Institute for Statistics
Categorias:
Education
Foi atualizado:
23 abr 2017 ano
Indicadores de alterações dos valores ao longo dos anos
Mínimo:
34.624
1 jan 2006 ano
Máximo:
49.408
1 jan 2010 ano
Na data de observação
Valor
Mudança absoluta
A alteração em relação ao valor anterior
1 jan 2002 ano
34.821
+34.821
0.0%
1 jan 2003 ano
36.329
+1.509
4.33%
1 jan 2004 ano
36.007
-0.322
-0.89%
1 jan 2005 ano
35.882
-0.126
-0.35%
1 jan 2006 ano
34.624
-1.257
-3.5%
1 jan 2007 ano
46.849
+12.224
35.31%
1 jan 2008 ano
48.161
+1.312
2.8%
1 jan 2009 ano
48.887
+0.726
1.51%
1 jan 2010 ano
49.408
+0.521
1.07%
1 jan 2011 ano
49.182
-0.225
-0.46%
1 jan 2012 ano
39.279
-9.903
-20.14%
1 jan 2013 ano
41.429
+2.149
5.47%
1 jan 2014 ano
45.304
+3.876
9.36%
1 jan 2015 ano
39.481
-5.824
-12.85%
Classificação de países por estatísticas atuais por anos


Comentários: