29
/pt/
pt
AIzaSyAYiBZKx7MnpbEhh9jyipgxe19OcubqV5w
April 1, 2024
157032
Iran, Islamic Rep.
IRN
true
2
1
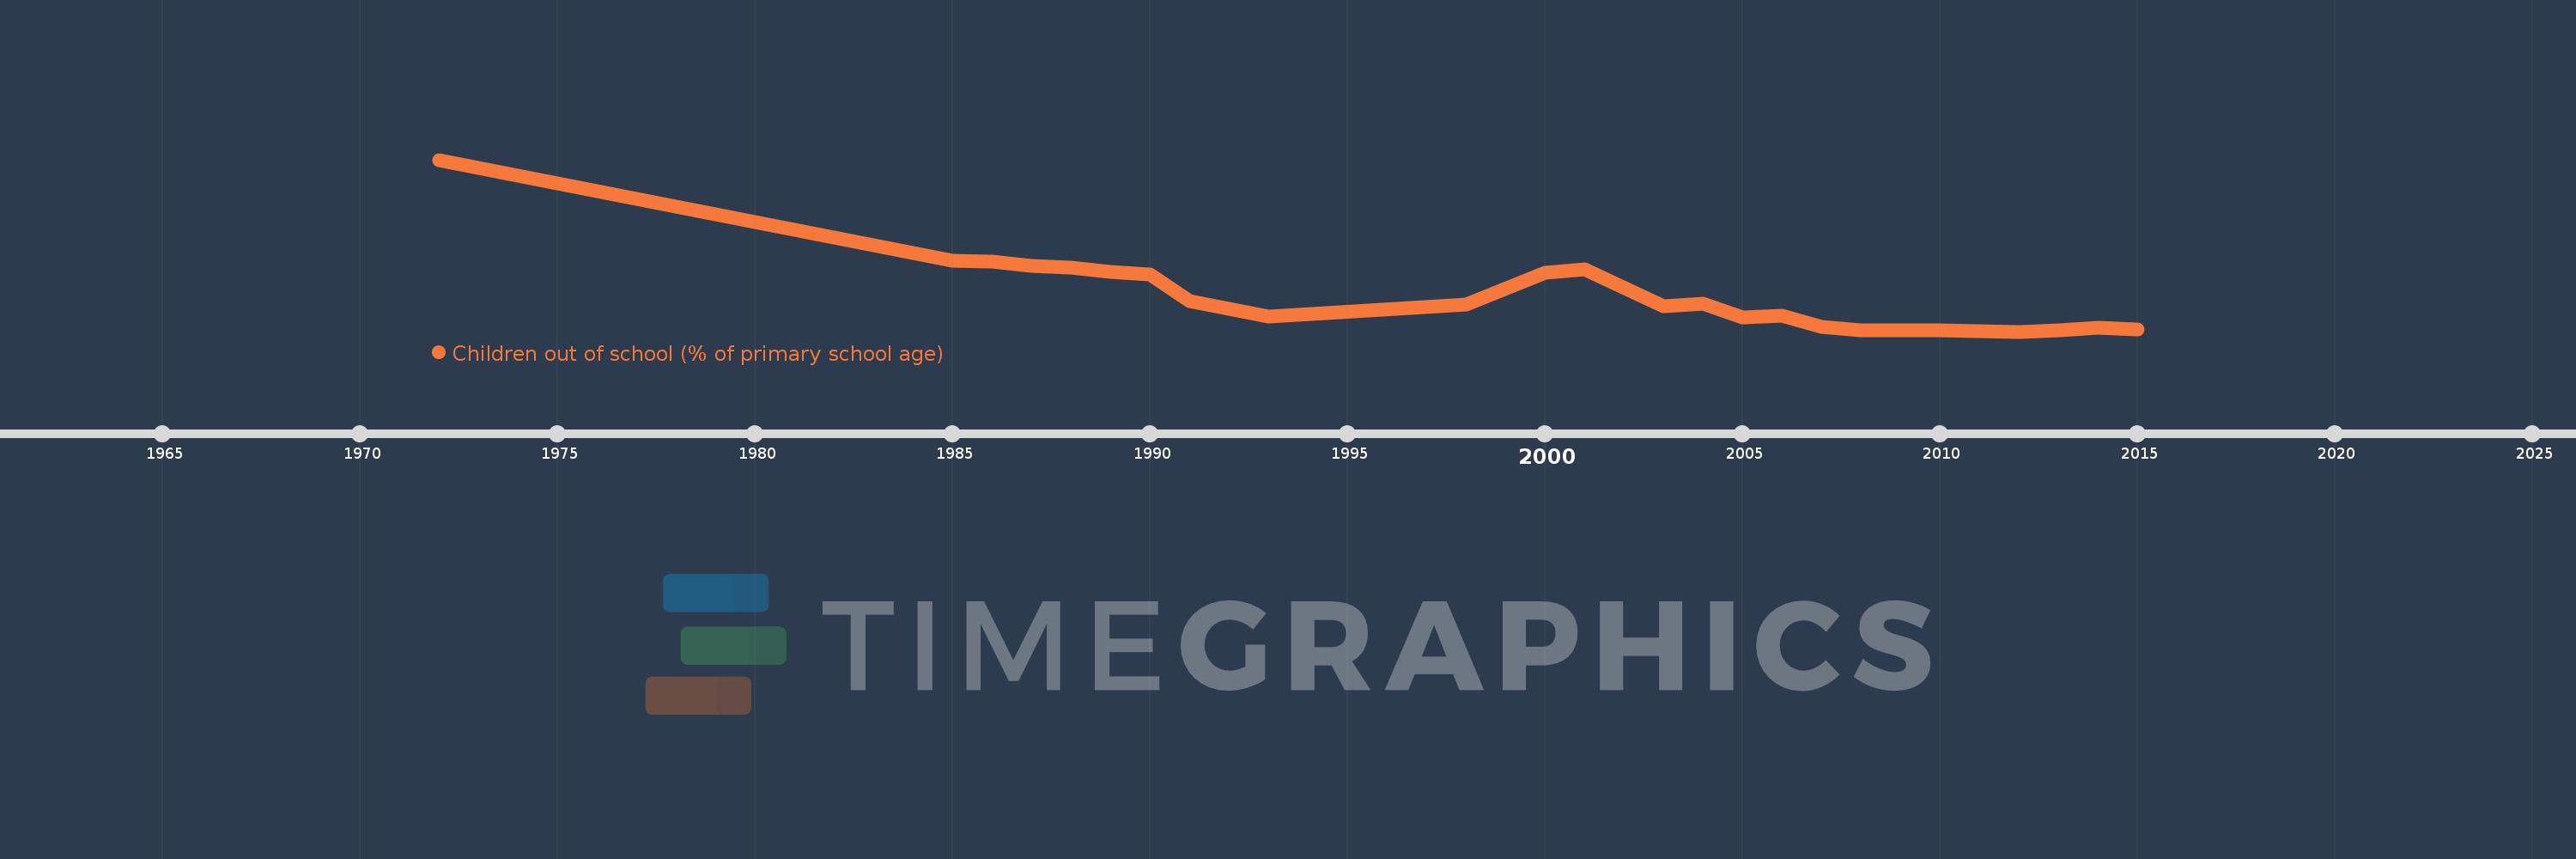
Children out of school (% of primary school age)
2015,2014,2013,2012,2011,2010,2008,2007,2006,2005,2004,2003,2001,2000,1998,1993,1991,1990,1989,1988,1987,1986,1985,1972
Estas estatísticas em outros países:
AfghanistanAlbaniaAlgeriaAngolaAntigua and BarbudaArab WorldArgentinaArmeniaArubaAustraliaAustriaAzerbaijanBahamas, TheBahrainBangladeshBarbadosBelarusBelgiumBelizeBeninBermudaBhutanBoliviaBosnia and HerzegovinaBotswanaBrazilBrunei DarussalamBulgariaBurkina FasoBurundiCabo VerdeCambodiaCameroonCanadaCaribbean small statesCentral African RepublicCentral Europe and the BalticsChadChileChinaColombiaComorosCongo, Dem. Rep.Congo, Rep.Costa RicaCote d'IvoireCroatiaCubaCyprusDenmarkDjiboutiDominicaDominican RepublicEarly-demographic dividendEast Asia & PacificEast Asia & Pacific (excluding high income)East Asia & Pacific (IDA & IBRD countries)EcuadorEgypt, Arab Rep.El SalvadorEquatorial GuineaEritreaEstoniaEthiopiaEuro areaEurope & Central AsiaEurope & Central Asia (excluding high income)Europe & Central Asia (IDA & IBRD countries)European UnionFijiFinlandFragile and conflict affected situationsFranceGabonGambia, TheGeorgiaGermanyGhanaGreeceGrenadaGuatemalaGuineaGuinea-BissauGuyanaHaitiHeavily indebted poor countries (HIPC)High incomeHondurasHong Kong SAR, ChinaHungaryIBRD onlyIcelandIDA & IBRD totalIDA blendIDA onlyIDA totalIndiaIndonesiaIran, Islamic Rep.IraqIrelandIsraelItalyJamaicaJapanJordanKazakhstanKenyaKiribatiKorea, Dem. People’s Rep.Korea, Rep.KuwaitKyrgyz RepublicLao PDRLate-demographic dividendLatin America & Caribbean Latin America & Caribbean (excluding high income)Latin America & the Caribbean (IDA & IBRD countries)LatviaLeast developed countries: UN classificationLebanonLesothoLiberiaLibyaLiechtensteinLithuaniaLow & middle incomeLow incomeLower middle incomeLuxembourgMacao SAR, ChinaMacedonia, FYRMadagascarMalawiMalaysiaMaldivesMaliMaltaMarshall IslandsMauritaniaMauritiusMexicoMicronesia, Fed. Sts.Middle East & North AfricaMiddle East & North Africa (excluding high income)Middle East & North Africa (IDA & IBRD countries)Middle incomeMoldovaMongoliaMontenegroMoroccoMozambiqueMyanmarNamibiaNauruNepalNetherlandsNew ZealandNicaraguaNigerNigeriaNorth AmericaNorwayOECD membersOmanOther small statesPacific island small statesPakistanPalauPanamaPapua New GuineaParaguayPeruPhilippinesPolandPortugalPost-demographic dividendPre-demographic dividendPuerto RicoQatarRomaniaRussian FederationRwandaSamoaSan MarinoSao Tome and PrincipeSaudi ArabiaSenegalSerbiaSeychellesSierra LeoneSloveniaSmall statesSolomon IslandsSomaliaSouth AfricaSouth AsiaSouth Asia (IDA & IBRD)South SudanSpainSri LankaSt. Kitts and NevisSt. LuciaSt. Vincent and the GrenadinesSub-Saharan Africa Sub-Saharan Africa (excluding high income)Sub-Saharan Africa (IDA & IBRD countries)SudanSurinameSwazilandSwedenSwitzerlandSyrian Arab RepublicTajikistanTanzaniaThailandTimor-LesteTogoTongaTrinidad and TobagoTunisiaTurkeyTuvaluUgandaUkraineUnited Arab EmiratesUnited KingdomUnited StatesUpper middle incomeUruguayUzbekistanVanuatuVenezuela, RBVietnamWest Bank and GazaWorldYemen, Rep.ZambiaZimbabwe Linha do tempo:
Nesta escala de tempo está apresentado um gráfico de 1972 ano até 2015 ano Iran, Islamic Rep.. Dados de 1971 ano ausente. O número de observações reais por data: 24.
Fonte (nome):
Indicadores de desenvolvimento mundial
Fonte (organização):
United Nations Educational, Scientific, and Cultural Organization (UNESCO) Institute for Statistics.
Categorias:
Education
Foi atualizado:
23 abr 2017 ano
Indicadores de alterações dos valores ao longo dos anos
Mínimo:
0.167
1 jan 2012 ano
Máximo:
40.658
1 jan 1972 ano
Na data de observação
Valor
Mudança absoluta
A alteração em relação ao valor anterior
1 jan 1972 ano
40.658
+40.658
0.0%
1 jan 1985 ano
16.795
-23.863
-58.69%
1 jan 1986 ano
16.639
-0.156
-0.93%
1 jan 1987 ano
15.68
-0.959
-5.76%
1 jan 1988 ano
15.249
-0.431
-2.75%
1 jan 1989 ano
14.274
-0.975
-6.39%
1 jan 1990 ano
13.709
-0.564
-3.95%
1 jan 1991 ano
7.434
-6.276
-45.78%
1 jan 1993 ano
3.633
-3.801
-51.13%
1 jan 1998 ano
6.551
+2.918
80.33%
1 jan 2000 ano
14.117
+7.566
115.48%
1 jan 2001 ano
14.748
+0.631
4.47%
1 jan 2003 ano
6.094
-8.654
-58.68%
1 jan 2004 ano
6.659
+0.565
9.27%
1 jan 2005 ano
3.594
-3.065
-46.03%
1 jan 2006 ano
3.817
+0.223
6.2%
1 jan 2007 ano
1.212
-2.605
-68.25%
1 jan 2008 ano
0.485
-0.727
-59.96%
1 jan 2010 ano
0.423
-0.063
-12.9%
1 jan 2011 ano
0.317
-0.106
-25.02%
1 jan 2012 ano
0.167
-0.15
-47.19%
1 jan 2013 ano
0.458
+0.291
173.75%
1 jan 2014 ano
1.177
+0.719
156.91%
1 jan 2015 ano
0.657
-0.52
-44.22%
Classificação de países por estatísticas atuais por anos


Comentários: