29
/pt/
pt
AIzaSyAYiBZKx7MnpbEhh9jyipgxe19OcubqV5w
April 1, 2024
156089
Indonesia
IDN
true
2
1
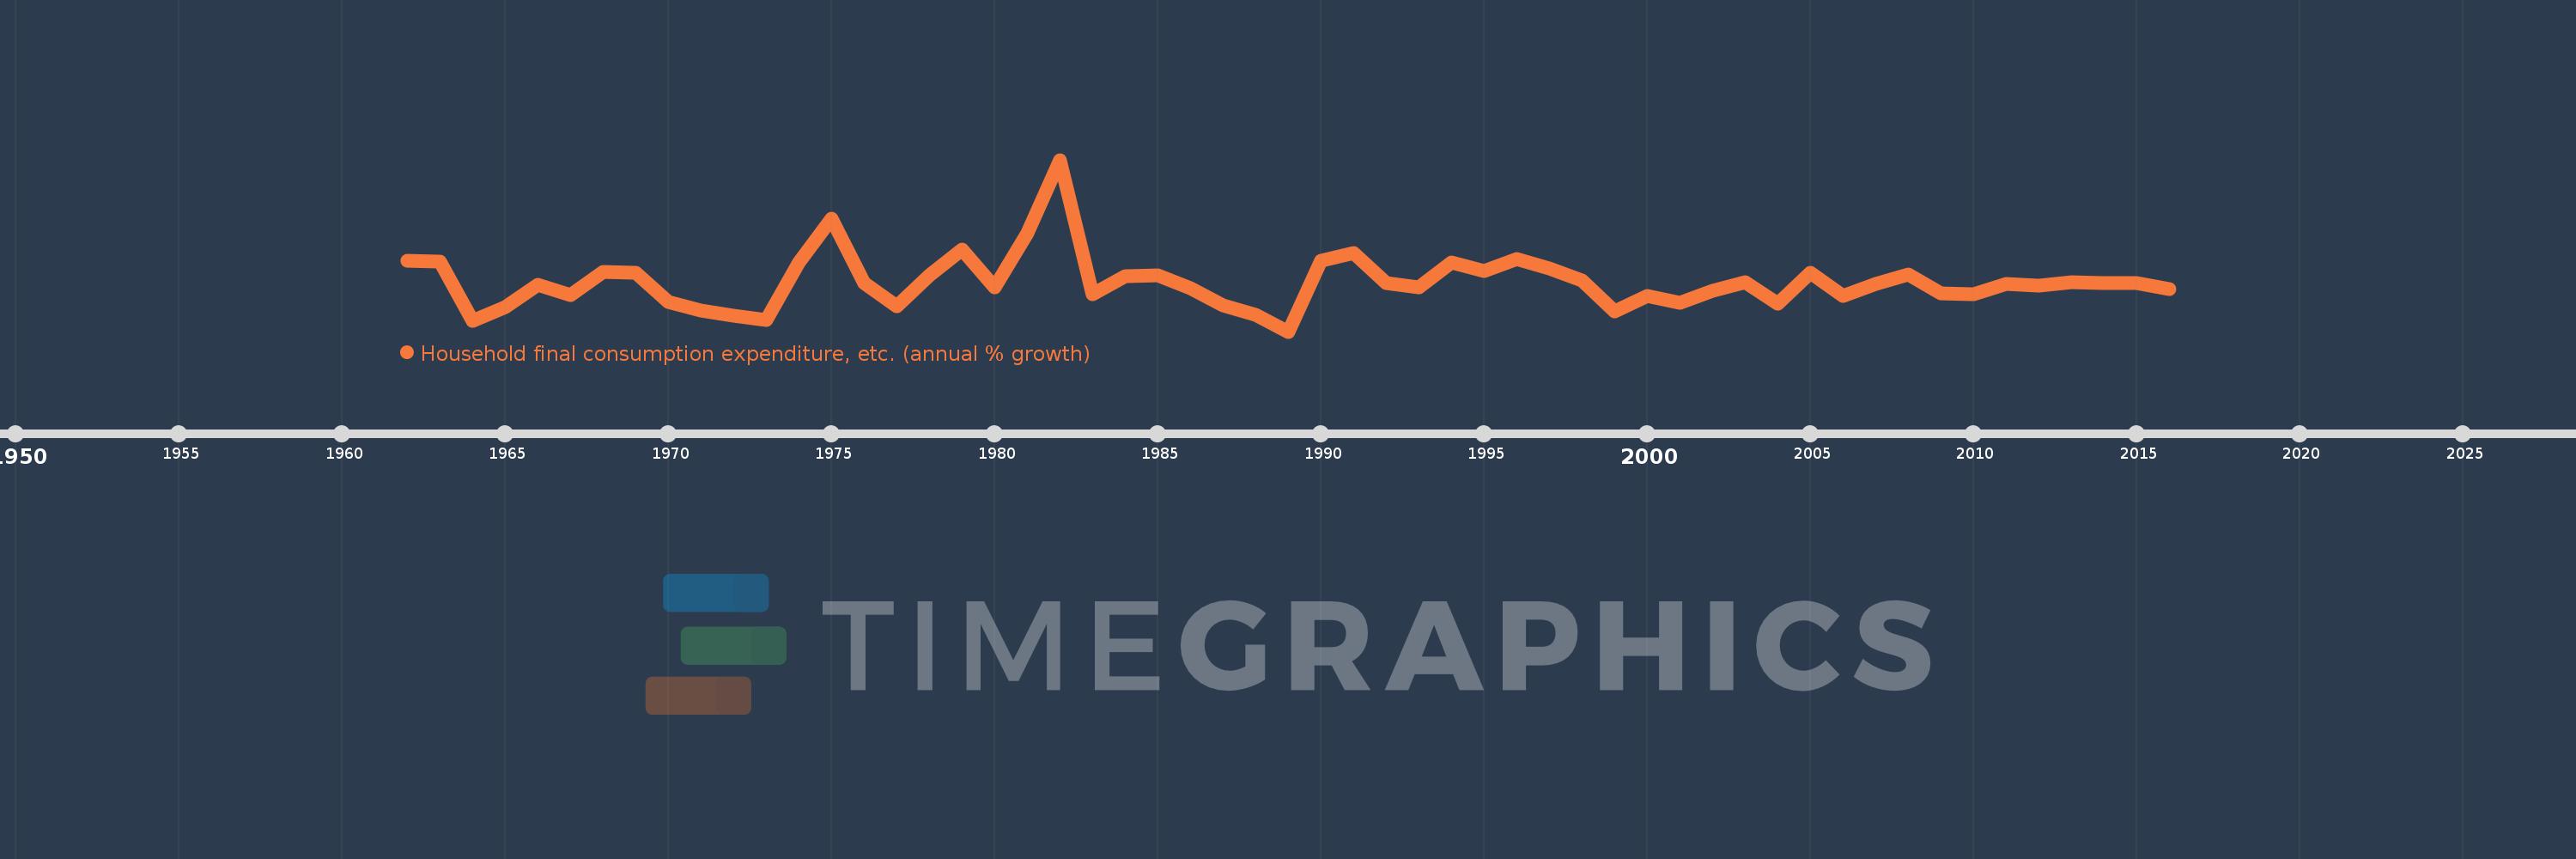
Household final consumption expenditure, etc. (annual % growth)
2016,2015,2014,2013,2012,2011,2010,2009,2008,2007,2006,2005,2004,2003,2002,2001,2000,1999,1998,1997,1996,1995,1994,1993,1992,1991,1990,1989,1988,1987,1986,1985,1984,1983,1982,1981,1980,1979,1978,1977,1976,1975,1974,1973,1972,1971,1970,1969,1968,1967,1966,1965,1964,1963,1962
Estas estatísticas em outros países:
AlbaniaAlgeriaAntigua and BarbudaArab WorldArgentinaArmeniaAustraliaAustriaAzerbaijanBahamas, TheBahrainBangladeshBarbadosBelarusBelgiumBelizeBeninBhutanBoliviaBosnia and HerzegovinaBotswanaBrazilBrunei DarussalamBulgariaBurkina FasoBurundiCabo VerdeCambodiaCameroonCanadaCaribbean small statesCentral Europe and the BalticsChadChileColombiaComorosCongo, Dem. Rep.Congo, Rep.Costa RicaCote d'IvoireCroatiaCubaCyprusCzech RepublicDenmarkDjiboutiDominican RepublicEarly-demographic dividendEast Asia & PacificEcuadorEgypt, Arab Rep.El SalvadorEquatorial GuineaEritreaEstoniaEthiopiaEuro areaEurope & Central AsiaEurope & Central Asia (excluding high income)Europe & Central Asia (IDA & IBRD countries)European UnionFijiFinlandFranceGabonGambia, TheGeorgiaGermanyGhanaGreeceGuatemalaGuineaGuinea-BissauHaitiHeavily indebted poor countries (HIPC)High incomeHondurasHong Kong SAR, ChinaHungaryIBRD onlyIcelandIDA & IBRD totalIDA blendIDA onlyIDA totalIndiaIndonesiaIran, Islamic Rep.IrelandIsraelItalyJamaicaJapanJordanKazakhstanKenyaKorea, Rep.KosovoKuwaitKyrgyz RepublicLao PDRLatin America & Caribbean Latin America & Caribbean (excluding high income)Latin America & the Caribbean (IDA & IBRD countries)LatviaLeast developed countries: UN classificationLebanonLiberiaLithuaniaLow & middle incomeLow incomeLower middle incomeLuxembourgMacao SAR, ChinaMacedonia, FYRMadagascarMalawiMalaysiaMaliMaltaMarshall IslandsMauritaniaMauritiusMexicoMiddle East & North AfricaMiddle East & North Africa (excluding high income)Middle East & North Africa (IDA & IBRD countries)Middle incomeMoldovaMongoliaMontenegroMoroccoMozambiqueNamibiaNepalNetherlandsNew ZealandNicaraguaNigerNigeriaNorth AmericaNorwayOECD membersOmanOther small statesPakistanPanamaPapua New GuineaParaguayPeruPhilippinesPolandPortugalPost-demographic dividendPre-demographic dividendPuerto RicoQatarRomaniaRussian FederationRwandaSaudi ArabiaSenegalSerbiaSeychellesSierra LeoneSingaporeSlovak RepublicSloveniaSmall statesSomaliaSouth AfricaSouth AsiaSouth Asia (IDA & IBRD)South SudanSpainSri LankaSub-Saharan Africa Sub-Saharan Africa (excluding high income)Sub-Saharan Africa (IDA & IBRD countries)SudanSurinameSwazilandSwedenSwitzerlandSyrian Arab RepublicTajikistanTanzaniaThailandTimor-LesteTogoTrinidad and TobagoTunisiaTurkeyTurkmenistanUgandaUkraineUnited Arab EmiratesUnited KingdomUnited StatesUpper middle incomeUruguayVanuatuVenezuela, RBVietnamWest Bank and GazaWorldZambiaZimbabwe Linha do tempo:
Nesta escala de tempo está apresentado um gráfico de 1962 ano até 2016 ano Indonesia. Dados de 1961 ano ausente. O número de observações reais por data: 55.
Fonte (nome):
Indicadores de desenvolvimento mundial
Fonte (organização):
World Bank national accounts data, and OECD National Accounts data files.
Categorias:
Economy & Growth
Foi atualizado:
23 abr 2017 ano
Indicadores de alterações dos valores ao longo dos anos
Mínimo:
-8.433
1 jan 1989 ano
Máximo:
42.531
1 jan 1982 ano
Na data de observação
Valor
Mudança absoluta
A alteração em relação ao valor anterior
1 jan 1962 ano
12.587
+12.587
0.0%
1 jan 1963 ano
12.394
-0.193
-1.53%
1 jan 1964 ano
-5.364
-17.758
-143.28%
1 jan 1965 ano
-1.147
+4.217
-78.61%
1 jan 1966 ano
5.532
+6.679
-582.19%
1 jan 1967 ano
2.415
-3.116
-56.34%
1 jan 1968 ano
9.393
+6.978
288.89%
1 jan 1969 ano
8.957
-0.436
-4.64%
1 jan 1970 ano
0.325
-8.632
-96.37%
1 jan 1971 ano
-2.142
-2.467
-759.39%
1 jan 1972 ano
-3.653
-1.511
70.53%
1 jan 1973 ano
-4.876
-1.223
33.48%
1 jan 1974 ano
11.982
+16.857
-345.75%
1 jan 1975 ano
25.027
+13.046
108.88%
1 jan 1976 ano
6.004
-19.024
-76.01%
1 jan 1977 ano
-0.861
-6.865
-114.34%
1 jan 1978 ano
8.287
+9.148
-1.06 mil%
1 jan 1979 ano
16.0
+7.713
93.07%
1 jan 1980 ano
4.768
-11.232
-70.2%
1 jan 1981 ano
20.708
+15.94
334.28%
1 jan 1982 ano
42.531
+21.823
105.38%
1 jan 1983 ano
2.567
-39.964
-93.96%
1 jan 1984 ano
7.983
+5.416
210.98%
1 jan 1985 ano
8.271
+0.288
3.61%
1 jan 1986 ano
4.537
-3.734
-45.15%
1 jan 1987 ano
-0.608
-5.145
-113.4%
1 jan 1988 ano
-3.557
-2.949
484.85%
1 jan 1989 ano
-8.433
-4.877
137.11%
1 jan 1990 ano
12.532
+20.966
-248.6%
1 jan 1991 ano
15.008
+2.476
19.75%
1 jan 1992 ano
5.859
-9.149
-60.96%
1 jan 1993 ano
4.753
-1.106
-18.88%
1 jan 1994 ano
12.036
+7.283
153.24%
1 jan 1995 ano
9.628
-2.408
-20.01%
1 jan 1996 ano
13.213
+3.585
37.23%
1 jan 1997 ano
10.296
-2.917
-22.08%
1 jan 1998 ano
6.612
-3.683
-35.78%
1 jan 1999 ano
-2.522
-9.134
-138.14%
1 jan 2000 ano
2.236
+4.758
-188.67%
1 jan 2001 ano
0.158
-2.078
-92.92%
1 jan 2002 ano
3.712
+3.553
2.24 mil%
1 jan 2003 ano
6.323
+2.612
70.36%
1 jan 2004 ano
-0.064
-6.388
-101.02%
1 jan 2005 ano
8.946
+9.01
-14.0 mil%
1 jan 2006 ano
2.212
-6.734
-75.27%
1 jan 2007 ano
5.592
+3.38
152.83%
1 jan 2008 ano
8.404
+2.811
50.27%
1 jan 2009 ano
2.801
-5.603
-66.67%
1 jan 2010 ano
2.713
-0.089
-3.17%
1 jan 2011 ano
5.66
+2.947
108.66%
1 jan 2012 ano
5.092
-0.567
-10.03%
1 jan 2013 ano
6.245
+1.153
22.63%
1 jan 2014 ano
6.058
-0.187
-2.99%
1 jan 2015 ano
5.912
-0.146
-2.41%
1 jan 2016 ano
4.095
-1.817
-30.74%
Classificação de países por estatísticas atuais por anos


Comentários: