29
/pt/
pt
AIzaSyAYiBZKx7MnpbEhh9jyipgxe19OcubqV5w
April 1, 2024
154773
India
IND
true
2
1
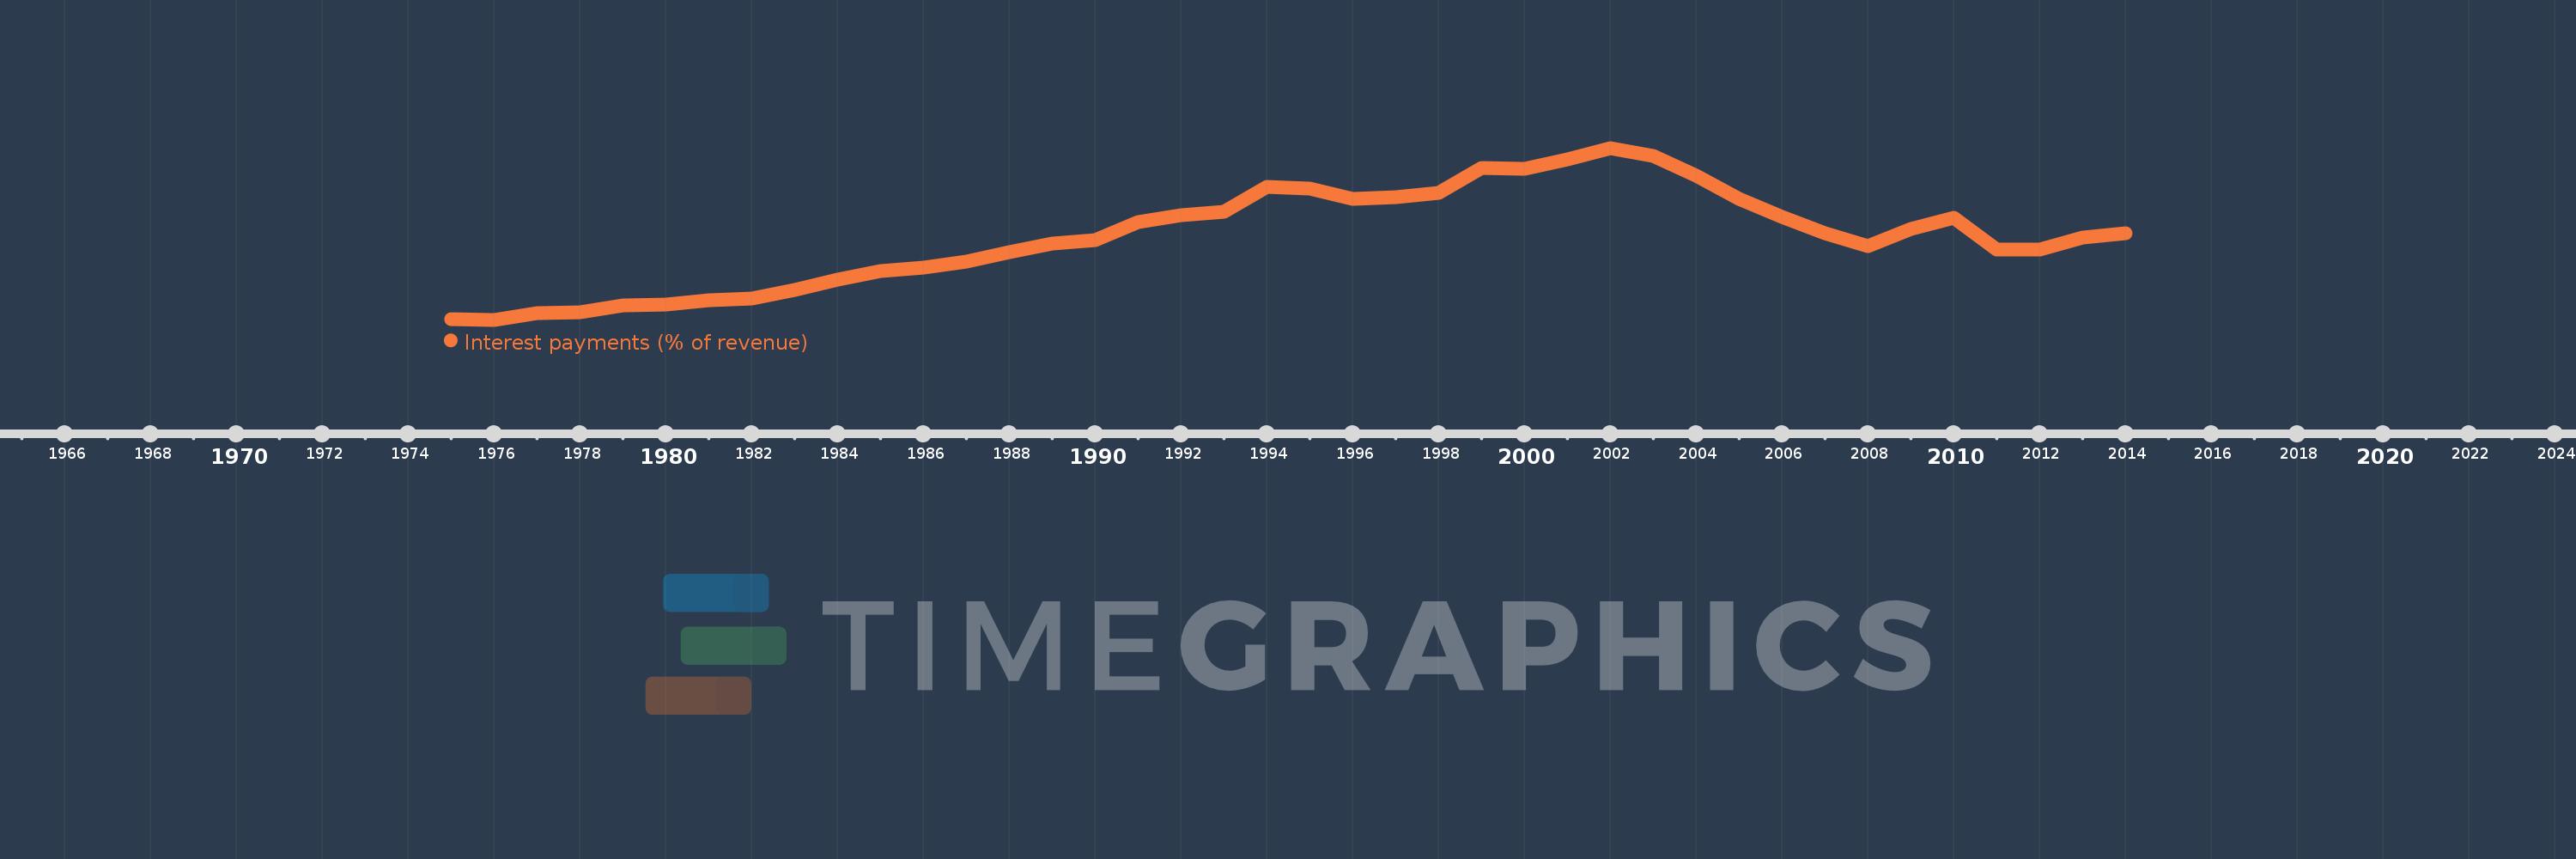
Interest payments (% of revenue)
2014,2013,2012,2011,2010,2009,2008,2007,2006,2005,2004,2003,2002,2001,2000,1999,1998,1997,1996,1995,1994,1993,1992,1991,1990,1989,1988,1987,1986,1985,1984,1983,1982,1981,1980,1979,1978,1977,1976,1975
Estas estatísticas em outros países:
AfghanistanAlbaniaAlgeriaAngolaAntigua and BarbudaArab WorldArmeniaAustraliaAustriaAzerbaijanBahamas, TheBahrainBangladeshBarbadosBelarusBelgiumBelizeBeninBhutanBoliviaBosnia and HerzegovinaBotswanaBrazilBulgariaBurkina FasoBurundiCabo VerdeCambodiaCanadaCaribbean small statesCentral African RepublicCentral Europe and the BalticsChileChinaColombiaCongo, Dem. Rep.Congo, Rep.Costa RicaCote d'IvoireCroatiaCyprusCzech RepublicDenmarkDominicaDominican RepublicEarly-demographic dividendEast Asia & PacificEast Asia & Pacific (excluding high income)East Asia & Pacific (IDA & IBRD countries)Egypt, Arab Rep.El SalvadorEquatorial GuineaEstoniaEthiopiaEuro areaEurope & Central AsiaEurope & Central Asia (excluding high income)Europe & Central Asia (IDA & IBRD countries)European UnionFijiFinlandFranceGambia, TheGeorgiaGermanyGhanaGreeceGrenadaGuatemalaHeavily indebted poor countries (HIPC)High incomeHondurasHong Kong SAR, ChinaHungaryIBRD onlyIcelandIDA & IBRD totalIDA blendIDA onlyIDA totalIndiaIndonesiaIran, Islamic Rep.IraqIrelandIsraelItalyJamaicaJapanJordanKazakhstanKenyaKiribatiKorea, Rep.KuwaitKyrgyz RepublicLao PDRLate-demographic dividendLatin America & Caribbean Latin America & Caribbean (excluding high income)Latin America & the Caribbean (IDA & IBRD countries)LatviaLeast developed countries: UN classificationLebanonLesothoLiberiaLithuaniaLow & middle incomeLow incomeLower middle incomeLuxembourgMacao SAR, ChinaMacedonia, FYRMadagascarMalawiMalaysiaMaldivesMaliMaltaMauritiusMexicoMicronesia, Fed. Sts.Middle East & North AfricaMiddle East & North Africa (excluding high income)Middle East & North Africa (IDA & IBRD countries)Middle incomeMoldovaMongoliaMoroccoMozambiqueNamibiaNepalNetherlandsNew ZealandNicaraguaNigeriaNorth AmericaNorwayOECD membersOmanOther small statesPakistanPanamaPapua New GuineaParaguayPeruPhilippinesPolandPortugalPost-demographic dividendPre-demographic dividendQatarRomaniaRussian FederationRwandaSamoaSan MarinoSao Tome and PrincipeSenegalSerbiaSeychellesSierra LeoneSingaporeSlovak RepublicSloveniaSmall statesSolomon IslandsSouth AfricaSouth AsiaSouth Asia (IDA & IBRD)SpainSri LankaSt. Kitts and NevisSt. LuciaSub-Saharan Africa Sub-Saharan Africa (excluding high income)Sub-Saharan Africa (IDA & IBRD countries)SurinameSwazilandSwedenSwitzerlandSyrian Arab RepublicTajikistanTanzaniaThailandTimor-LesteTogoTrinidad and TobagoTunisiaTurkeyUgandaUkraineUnited KingdomUnited StatesUpper middle incomeUruguayVanuatuVenezuela, RBVietnamWest Bank and GazaWorldYemen, Rep.ZambiaZimbabwe Linha do tempo:
Nesta escala de tempo está apresentado um gráfico de 1975 ano até 2014 ano India. Dados de 1974 ano ausente. O número de observações reais por data: 40.
Fonte (nome):
Indicadores de desenvolvimento mundial
Fonte (organização):
International Monetary Fund, Government Finance Statistics Yearbook and data files.
Categorias:
Public Sector
Foi atualizado:
23 abr 2017 ano
Indicadores de alterações dos valores ao longo dos anos
Mínimo:
10.273
1 jan 1976 ano
Máximo:
40.936
1 jan 2002 ano
Na data de observação
Valor
Mudança absoluta
A alteração em relação ao valor anterior
1 jan 1975 ano
10.339
+10.339
0.0%
1 jan 1976 ano
10.273
-0.066
-0.63%
1 jan 1977 ano
11.467
+1.194
11.62%
1 jan 1978 ano
11.595
+0.127
1.11%
1 jan 1979 ano
12.777
+1.182
10.2%
1 jan 1980 ano
12.926
+0.149
1.16%
1 jan 1981 ano
13.78
+0.854
6.61%
1 jan 1982 ano
14.073
+0.293
2.13%
1 jan 1983 ano
15.563
+1.49
10.59%
1 jan 1984 ano
17.461
+1.898
12.19%
1 jan 1985 ano
19.011
+1.551
8.88%
1 jan 1986 ano
19.624
+0.613
3.22%
1 jan 1987 ano
20.587
+0.962
4.9%
1 jan 1988 ano
22.399
+1.812
8.8%
1 jan 1989 ano
23.935
+1.536
6.86%
1 jan 1990 ano
24.459
+0.524
2.19%
1 jan 1991 ano
27.639
+3.18
13.0%
1 jan 1992 ano
28.924
+1.284
4.65%
1 jan 1993 ano
29.5
+0.576
1.99%
1 jan 1994 ano
33.974
+4.474
15.17%
1 jan 1995 ano
33.638
-0.337
-0.99%
1 jan 1996 ano
31.889
-1.748
-5.2%
1 jan 1997 ano
32.151
+0.262
0.82%
1 jan 1998 ano
32.942
+0.791
2.46%
1 jan 1999 ano
37.405
+4.464
13.55%
1 jan 2000 ano
37.158
-0.247
-0.66%
1 jan 2001 ano
38.912
+1.754
4.72%
1 jan 2002 ano
40.936
+2.024
5.2%
1 jan 2003 ano
39.47
-1.467
-3.58%
1 jan 2004 ano
36.059
-3.411
-8.64%
1 jan 2005 ano
31.907
-4.152
-11.51%
1 jan 2006 ano
28.571
-3.336
-10.45%
1 jan 2007 ano
25.639
-2.932
-10.26%
1 jan 2008 ano
23.37
-2.269
-8.85%
1 jan 2009 ano
26.539
+3.168
13.56%
1 jan 2010 ano
28.463
+1.924
7.25%
1 jan 2011 ano
22.826
-5.637
-19.81%
1 jan 2012 ano
22.868
+0.043
0.19%
1 jan 2013 ano
24.909
+2.04
8.92%
1 jan 2014 ano
25.689
+0.78
3.13%
Classificação de países por estatísticas atuais por anos


Comentários: