29
/pt/
pt
AIzaSyAYiBZKx7MnpbEhh9jyipgxe19OcubqV5w
April 1, 2024
153546
Iceland
ISL
true
2
1
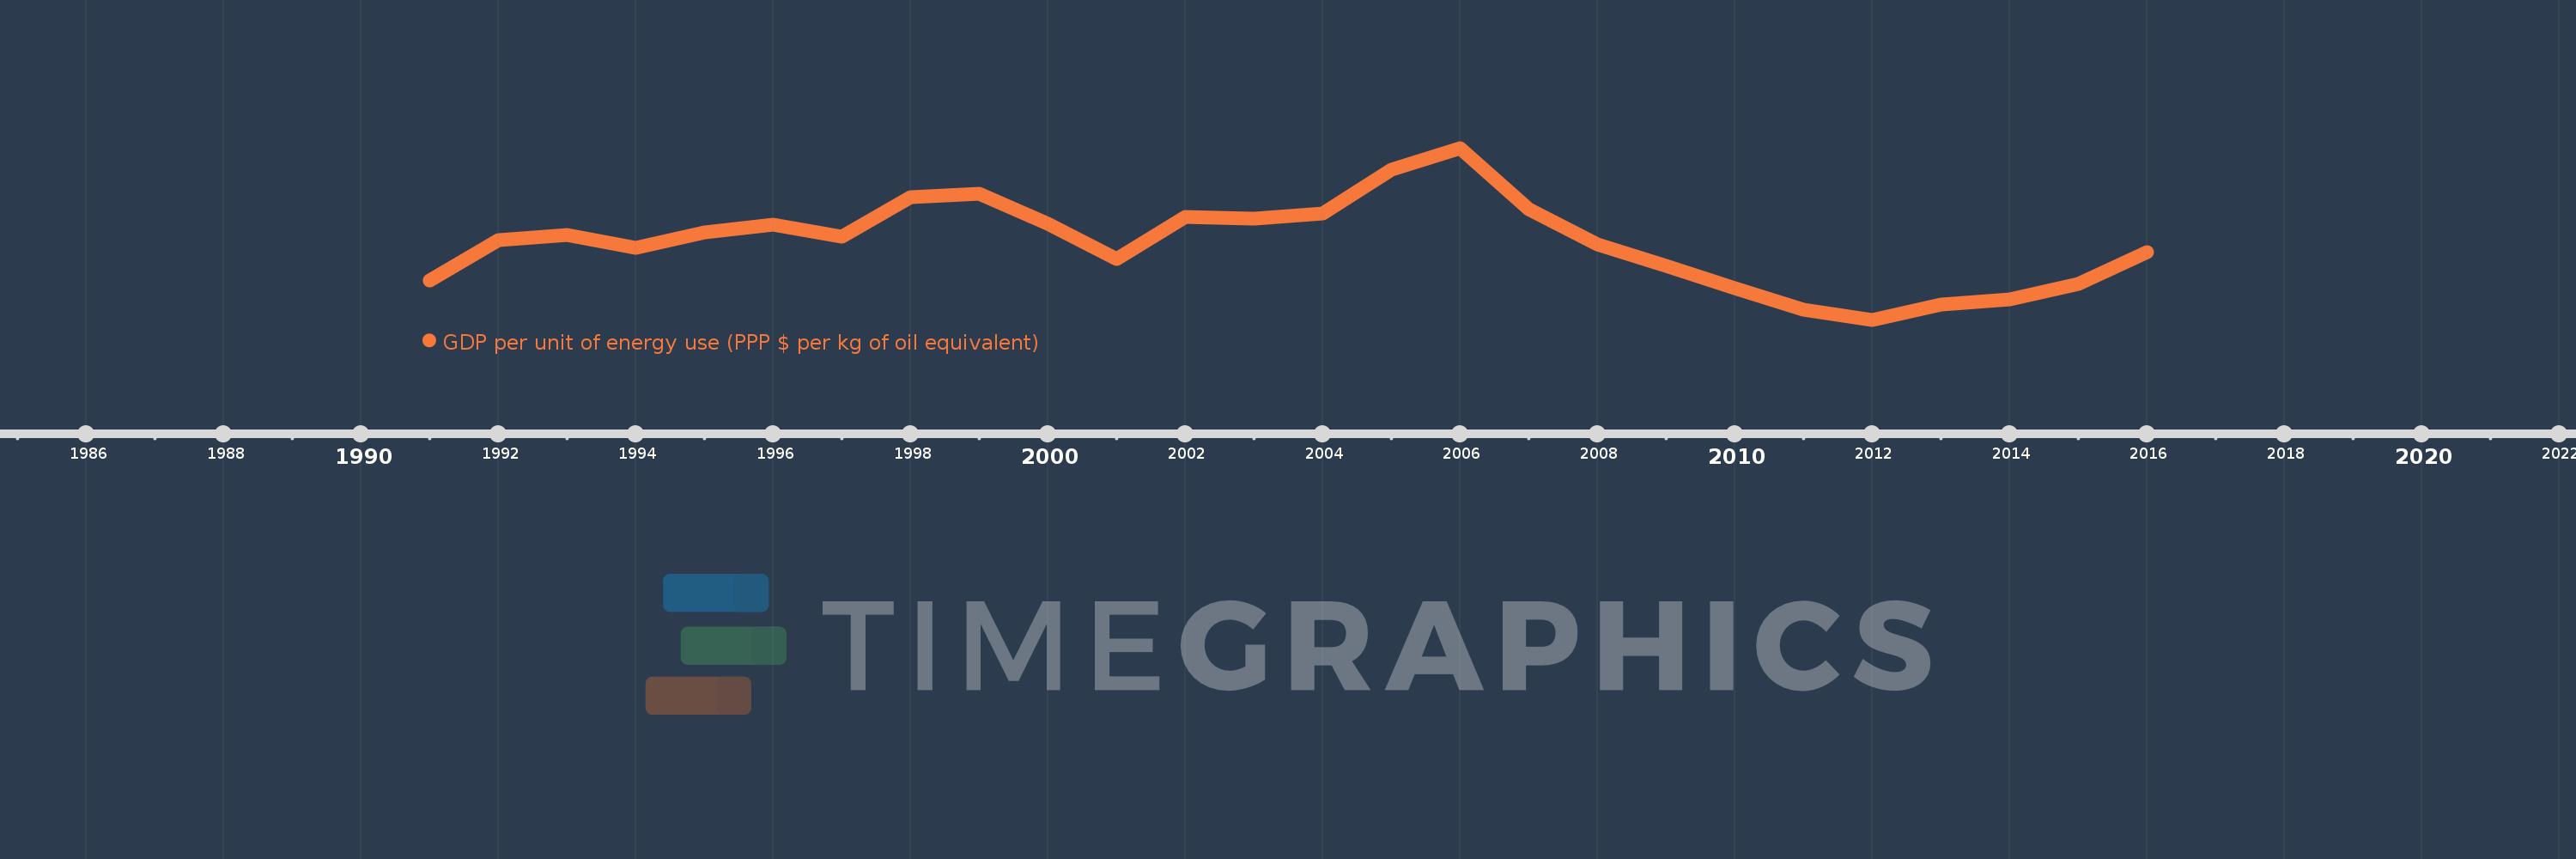
GDP per unit of energy use (PPP $ per kg of oil equivalent)
2016,2015,2014,2013,2012,2011,2010,2009,2008,2007,2006,2005,2004,2003,2002,2001,2000,1999,1998,1997,1996,1995,1994,1993,1992,1991
Estas estatísticas em outros países:
AlbaniaAlgeriaAngolaAntigua and BarbudaArab WorldArgentinaArmeniaAustraliaAustriaAzerbaijanBahamas, TheBahrainBangladeshBarbadosBelarusBelgiumBelizeBeninBhutanBoliviaBosnia and HerzegovinaBotswanaBrazilBrunei DarussalamBulgariaCabo VerdeCambodiaCameroonCanadaCaribbean small statesCentral Europe and the BalticsChileChinaColombiaComorosCongo, Dem. Rep.Congo, Rep.Costa RicaCote d'IvoireCroatiaCubaCyprusCzech RepublicDenmarkDjiboutiDominicaDominican RepublicEarly-demographic dividendEast Asia & PacificEast Asia & Pacific (excluding high income)East Asia & Pacific (IDA & IBRD countries)EcuadorEgypt, Arab Rep.El SalvadorEquatorial GuineaEritreaEstoniaEthiopiaEuro areaEurope & Central AsiaEurope & Central Asia (excluding high income)Europe & Central Asia (IDA & IBRD countries)European UnionFijiFinlandFranceGabonGambia, TheGeorgiaGermanyGhanaGreeceGrenadaGuatemalaGuinea-BissauGuyanaHaitiHeavily indebted poor countries (HIPC)High incomeHondurasHong Kong SAR, ChinaHungaryIBRD onlyIcelandIDA & IBRD totalIDA blendIDA onlyIDA totalIndiaIndonesiaIran, Islamic Rep.IraqIrelandIsraelItalyJamaicaJapanJordanKazakhstanKenyaKiribatiKorea, Rep.KosovoKuwaitKyrgyz RepublicLate-demographic dividendLatin America & Caribbean Latin America & Caribbean (excluding high income)Latin America & the Caribbean (IDA & IBRD countries)LatviaLeast developed countries: UN classificationLebanonLesothoLibyaLithuaniaLow & middle incomeLower middle incomeLuxembourgMacedonia, FYRMalaysiaMaldivesMaltaMarshall IslandsMauritiusMexicoMiddle East & North AfricaMiddle East & North Africa (excluding high income)Middle East & North Africa (IDA & IBRD countries)Middle incomeMoldovaMongoliaMontenegroMoroccoMozambiqueMyanmarNamibiaNepalNetherlandsNew ZealandNicaraguaNigerNigeriaNorth AmericaNorwayOECD membersOmanOther small statesPacific island small statesPakistanPanamaParaguayPeruPhilippinesPolandPortugalPost-demographic dividendPre-demographic dividendQatarRomaniaRussian FederationSamoaSao Tome and PrincipeSaudi ArabiaSenegalSerbiaSeychellesSingaporeSlovak RepublicSloveniaSmall statesSolomon IslandsSouth AfricaSouth AsiaSouth Asia (IDA & IBRD)South SudanSpainSri LankaSt. Kitts and NevisSt. LuciaSt. Vincent and the GrenadinesSub-Saharan Africa Sub-Saharan Africa (excluding high income)Sub-Saharan Africa (IDA & IBRD countries)SudanSurinameSwazilandSwedenSwitzerlandTajikistanTanzaniaThailandTimor-LesteTogoTongaTrinidad and TobagoTunisiaTurkeyTurkmenistanUkraineUnited Arab EmiratesUnited KingdomUnited StatesUpper middle incomeUruguayUzbekistanVanuatuVenezuela, RBVietnamWorldYemen, Rep.ZambiaZimbabwe Linha do tempo:
Nesta escala de tempo está apresentado um gráfico de 1991 ano até 2016 ano Iceland. Dados de 1990 ano ausente. O número de observações reais por data: 26.
Fonte (nome):
Indicadores de desenvolvimento mundial
Fonte (organização):
IEA Statistics © OECD/IEA 2014 (http://www.iea.org/stats/index.asp), subject to https://www.iea.org/t&c/termsandconditions/
Categorias:
Energy & Mining
Foi atualizado:
23 abr 2017 ano
Indicadores de alterações dos valores ao longo dos anos
Mínimo:
2.172
1 jan 2012 ano
Máximo:
3.524
1 jan 2006 ano
Na data de observação
Valor
Mudança absoluta
A alteração em relação ao valor anterior
1 jan 1991 ano
2.484
+2.484
0.0%
1 jan 1992 ano
2.8
+0.316
12.71%
1 jan 1993 ano
2.838
+0.038
1.36%
1 jan 1994 ano
2.739
-0.099
-3.48%
1 jan 1995 ano
2.858
+0.119
4.35%
1 jan 1996 ano
2.919
+0.06
2.12%
1 jan 1997 ano
2.825
-0.093
-3.2%
1 jan 1998 ano
3.139
+0.314
11.1%
1 jan 1999 ano
3.162
+0.023
0.73%
1 jan 2000 ano
2.927
-0.235
-7.43%
1 jan 2001 ano
2.653
-0.274
-9.35%
1 jan 2002 ano
2.978
+0.325
12.26%
1 jan 2003 ano
2.967
-0.011
-0.38%
1 jan 2004 ano
3.008
+0.041
1.39%
1 jan 2005 ano
3.354
+0.346
11.49%
1 jan 2006 ano
3.524
+0.17
5.08%
1 jan 2007 ano
3.041
-0.484
-13.73%
1 jan 2008 ano
2.762
-0.279
-9.18%
1 jan 2009 ano
2.593
-0.168
-6.09%
1 jan 2010 ano
2.422
-0.171
-6.6%
1 jan 2011 ano
2.253
-0.169
-6.97%
1 jan 2012 ano
2.172
-0.081
-3.6%
1 jan 2013 ano
2.293
+0.12
5.55%
1 jan 2014 ano
2.332
+0.039
1.71%
1 jan 2015 ano
2.454
+0.122
5.23%
1 jan 2016 ano
2.701
+0.247
10.06%
Classificação de países por estatísticas atuais por anos


Comentários: