29
/pt/
pt
AIzaSyAYiBZKx7MnpbEhh9jyipgxe19OcubqV5w
April 1, 2024
152149
Hong Kong SAR, China
HKG
true
2
1
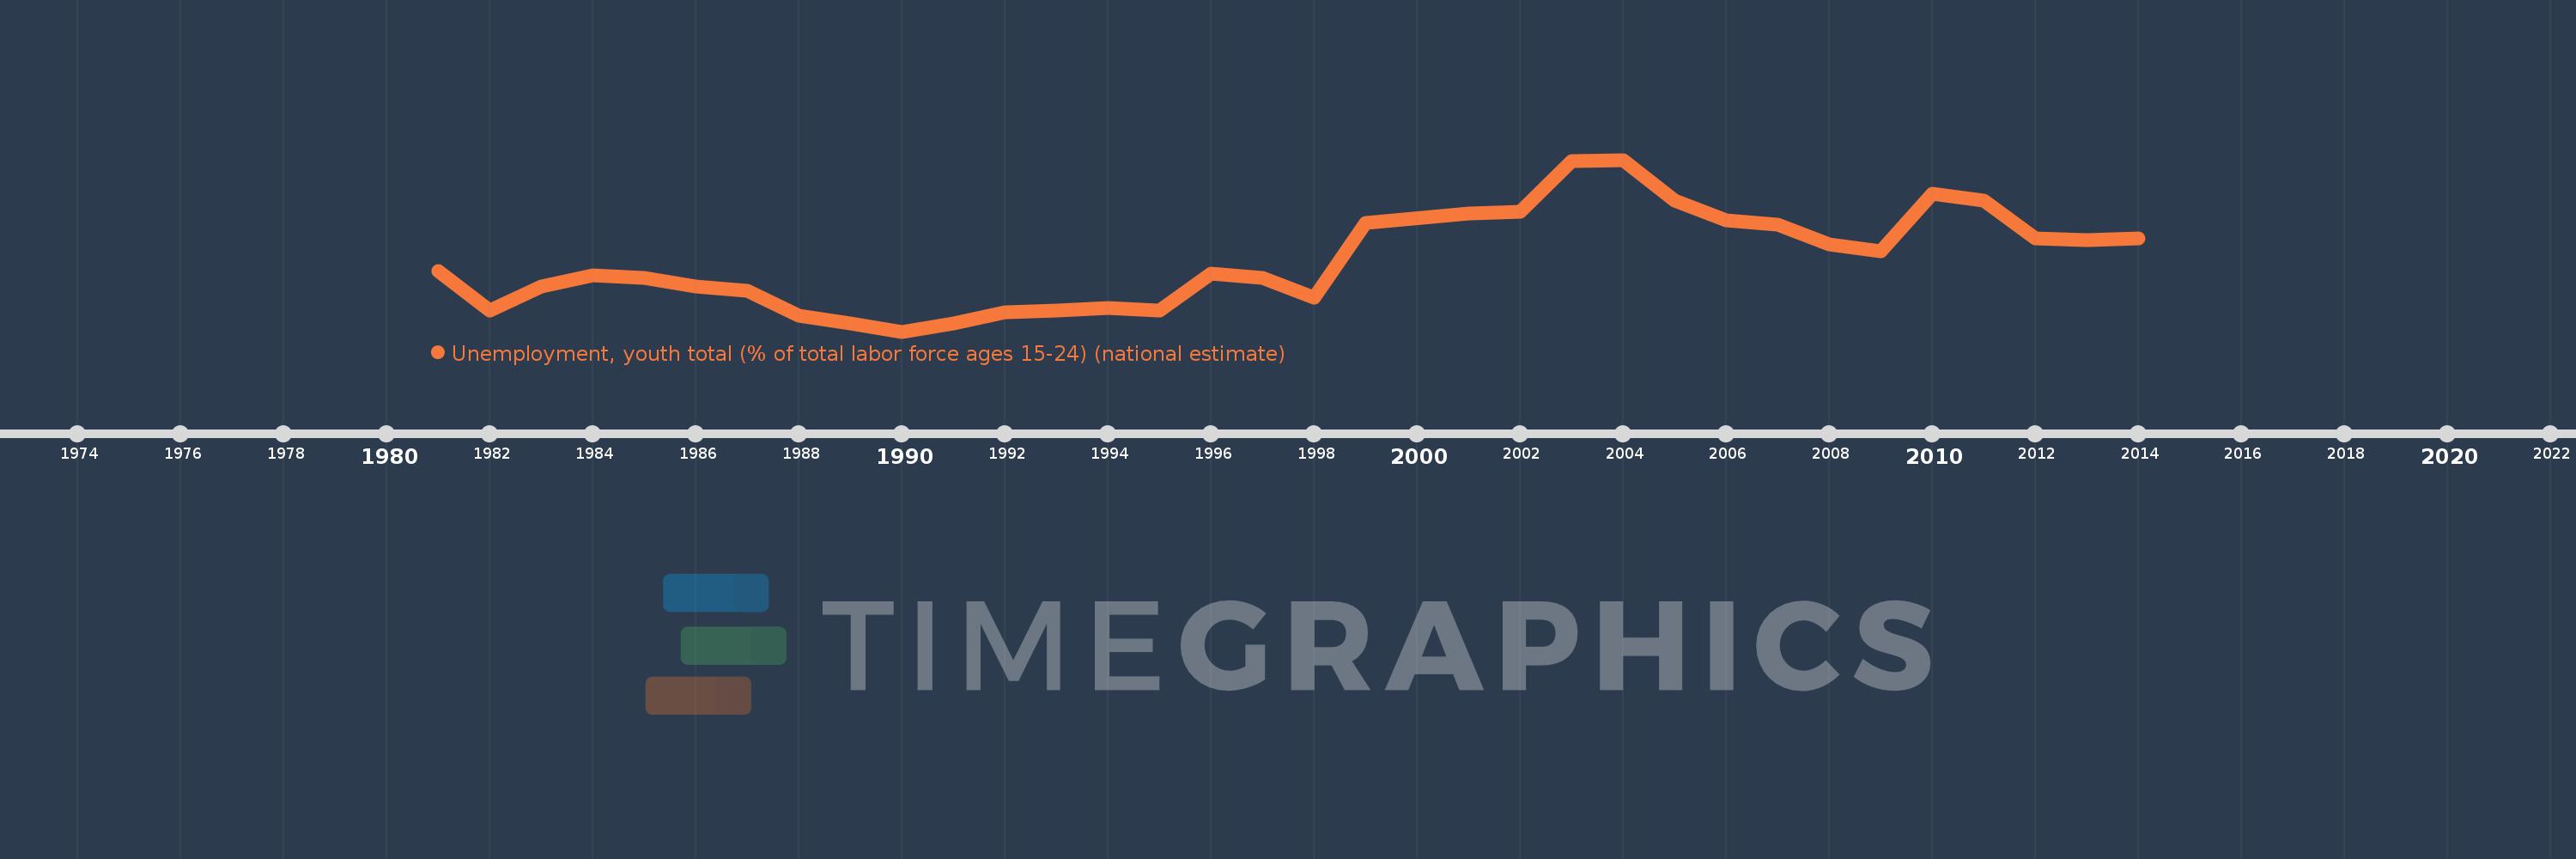
Unemployment, youth total (% of total labor force ages 15-24) (national estimate)
2014,2013,2012,2011,2010,2009,2008,2007,2006,2005,2004,2003,2002,2001,1999,1998,1997,1996,1995,1994,1993,1992,1991,1990,1989,1988,1987,1986,1985,1984,1983,1982,1981
Estas estatísticas em outros países:
AlbaniaAlgeriaAmerican SamoaAntigua and BarbudaArab WorldArgentinaArmeniaArubaAustraliaAustriaAzerbaijanBahamas, TheBahrainBangladeshBarbadosBelarusBelgiumBelizeBeninBermudaBhutanBoliviaBosnia and HerzegovinaBotswanaBrazilBritish Virgin IslandsBulgariaBurkina FasoBurundiCabo VerdeCambodiaCameroonCanadaCaribbean small statesCayman IslandsCentral Europe and the BalticsChileColombiaCosta RicaCroatiaCubaCyprusCzech RepublicDenmarkDominicaDominican RepublicEarly-demographic dividendEcuadorEgypt, Arab Rep.El SalvadorEstoniaEthiopiaEuro areaEurope & Central AsiaEurope & Central Asia (excluding high income)Europe & Central Asia (IDA & IBRD countries)European UnionFaroe IslandsFijiFinlandFranceFrench PolynesiaGabonGambia, TheGeorgiaGermanyGhanaGreeceGrenadaGuamGuatemalaGuineaGuyanaHaitiHigh incomeHondurasHong Kong SAR, ChinaHungaryIcelandIDA blendIndiaIndonesiaIran, Islamic Rep.IrelandIsle of ManIsraelItalyJamaicaJapanJordanKazakhstanKiribatiKorea, Rep.KosovoKuwaitKyrgyz RepublicLao PDRLatin America & Caribbean Latin America & Caribbean (excluding high income)Latin America & the Caribbean (IDA & IBRD countries)LatviaLebanonLesothoLiberiaLibyaLithuaniaLower middle incomeLuxembourgMacao SAR, ChinaMacedonia, FYRMadagascarMalawiMalaysiaMaldivesMaliMaltaMarshall IslandsMauritiusMexicoMiddle East & North AfricaMiddle East & North Africa (excluding high income)Middle East & North Africa (IDA & IBRD countries)MoldovaMonacoMongoliaMontenegroMoroccoMozambiqueNamibiaNauruNepalNetherlandsNew ZealandNicaraguaNigerNigeriaNorth AmericaNorthern Mariana IslandsNorwayOECD membersPakistanPalauPanamaPapua New GuineaParaguayPeruPhilippinesPolandPortugalPost-demographic dividendPuerto RicoQatarRomaniaRussian FederationRwandaSamoaSan MarinoSao Tome and PrincipeSaudi ArabiaSenegalSerbiaSeychellesSierra LeoneSingaporeSlovak RepublicSloveniaSolomon IslandsSouth AfricaSouth AsiaSouth Asia (IDA & IBRD)South SudanSpainSri LankaSt. Kitts and NevisSt. LuciaSt. Vincent and the GrenadinesSudanSurinameSwazilandSwedenSwitzerlandSyrian Arab RepublicTajikistanTanzaniaThailandTimor-LesteTongaTrinidad and TobagoTunisiaTurkeyUgandaUkraineUnited Arab EmiratesUnited KingdomUnited StatesUruguayVanuatuVenezuela, RBVietnamWest Bank and GazaYemen, Rep.ZambiaZimbabwe Linha do tempo:
Nesta escala de tempo está apresentado um gráfico de 1981 ano até 2014 ano Hong Kong SAR, China. Dados de 1980 ano ausente. O número de observações reais por data: 33.
Fonte (nome):
Indicadores de desenvolvimento mundial
Fonte (organização):
International Labour Organization, Key Indicators of the Labour Market database.
Categorias:
Social Protection & Labor
Foi atualizado:
23 abr 2017 ano
Indicadores de alterações dos valores ao longo dos anos
Máximo:
15.0
1 jan 2004 ano
Na data de observação
Valor
Mudança absoluta
A alteração em relação ao valor anterior
1 jan 1981 ano
7.1
+7.1
0.0%
1 jan 1982 ano
4.3
-2.8
-39.44%
1 jan 1983 ano
6.0
+1.7
39.53%
1 jan 1984 ano
6.8
+0.8
13.33%
1 jan 1985 ano
6.6
-0.2
-2.94%
1 jan 1986 ano
6.0
-0.6
-9.09%
1 jan 1987 ano
5.7
-0.3
-5.0%
1 jan 1988 ano
3.9
-1.8
-31.58%
1 jan 1989 ano
3.4
-0.5
-12.82%
1 jan 1990 ano
2.8
-0.6
-17.65%
1 jan 1991 ano
3.4
+0.6
21.43%
1 jan 1992 ano
4.2
+0.8
23.53%
1 jan 1993 ano
4.3
+0.1
2.38%
1 jan 1994 ano
4.5
+0.2
4.65%
1 jan 1995 ano
4.3
-0.2
-4.44%
1 jan 1996 ano
6.9
+2.6
60.47%
1 jan 1997 ano
6.6
-0.3
-4.35%
1 jan 1998 ano
5.2
-1.4
-21.21%
1 jan 1999 ano
10.5
+5.3
101.92%
1 jan 2001 ano
11.2
+0.7
6.67%
1 jan 2002 ano
11.3
+0.1
0.89%
1 jan 2003 ano
14.9
+3.6
31.86%
1 jan 2004 ano
15.0
+0.1
0.67%
1 jan 2005 ano
12.1
-2.9
-19.33%
1 jan 2006 ano
10.7
-1.4
-11.57%
1 jan 2007 ano
10.4
-0.3
-2.8%
1 jan 2008 ano
9.0
-1.4
-13.46%
1 jan 2009 ano
8.5
-0.5
-5.56%
1 jan 2010 ano
12.6
+4.1
48.24%
1 jan 2011 ano
12.1
-0.5
-3.97%
1 jan 2012 ano
9.4
-2.7
-22.31%
1 jan 2013 ano
9.3
-0.1
-1.06%
1 jan 2014 ano
9.4
+0.1
1.08%
Classificação de países por estatísticas atuais por anos


Comentários: