29
/pt/
pt
AIzaSyAYiBZKx7MnpbEhh9jyipgxe19OcubqV5w
April 1, 2024
141899
Greece
GRC
true
2
1
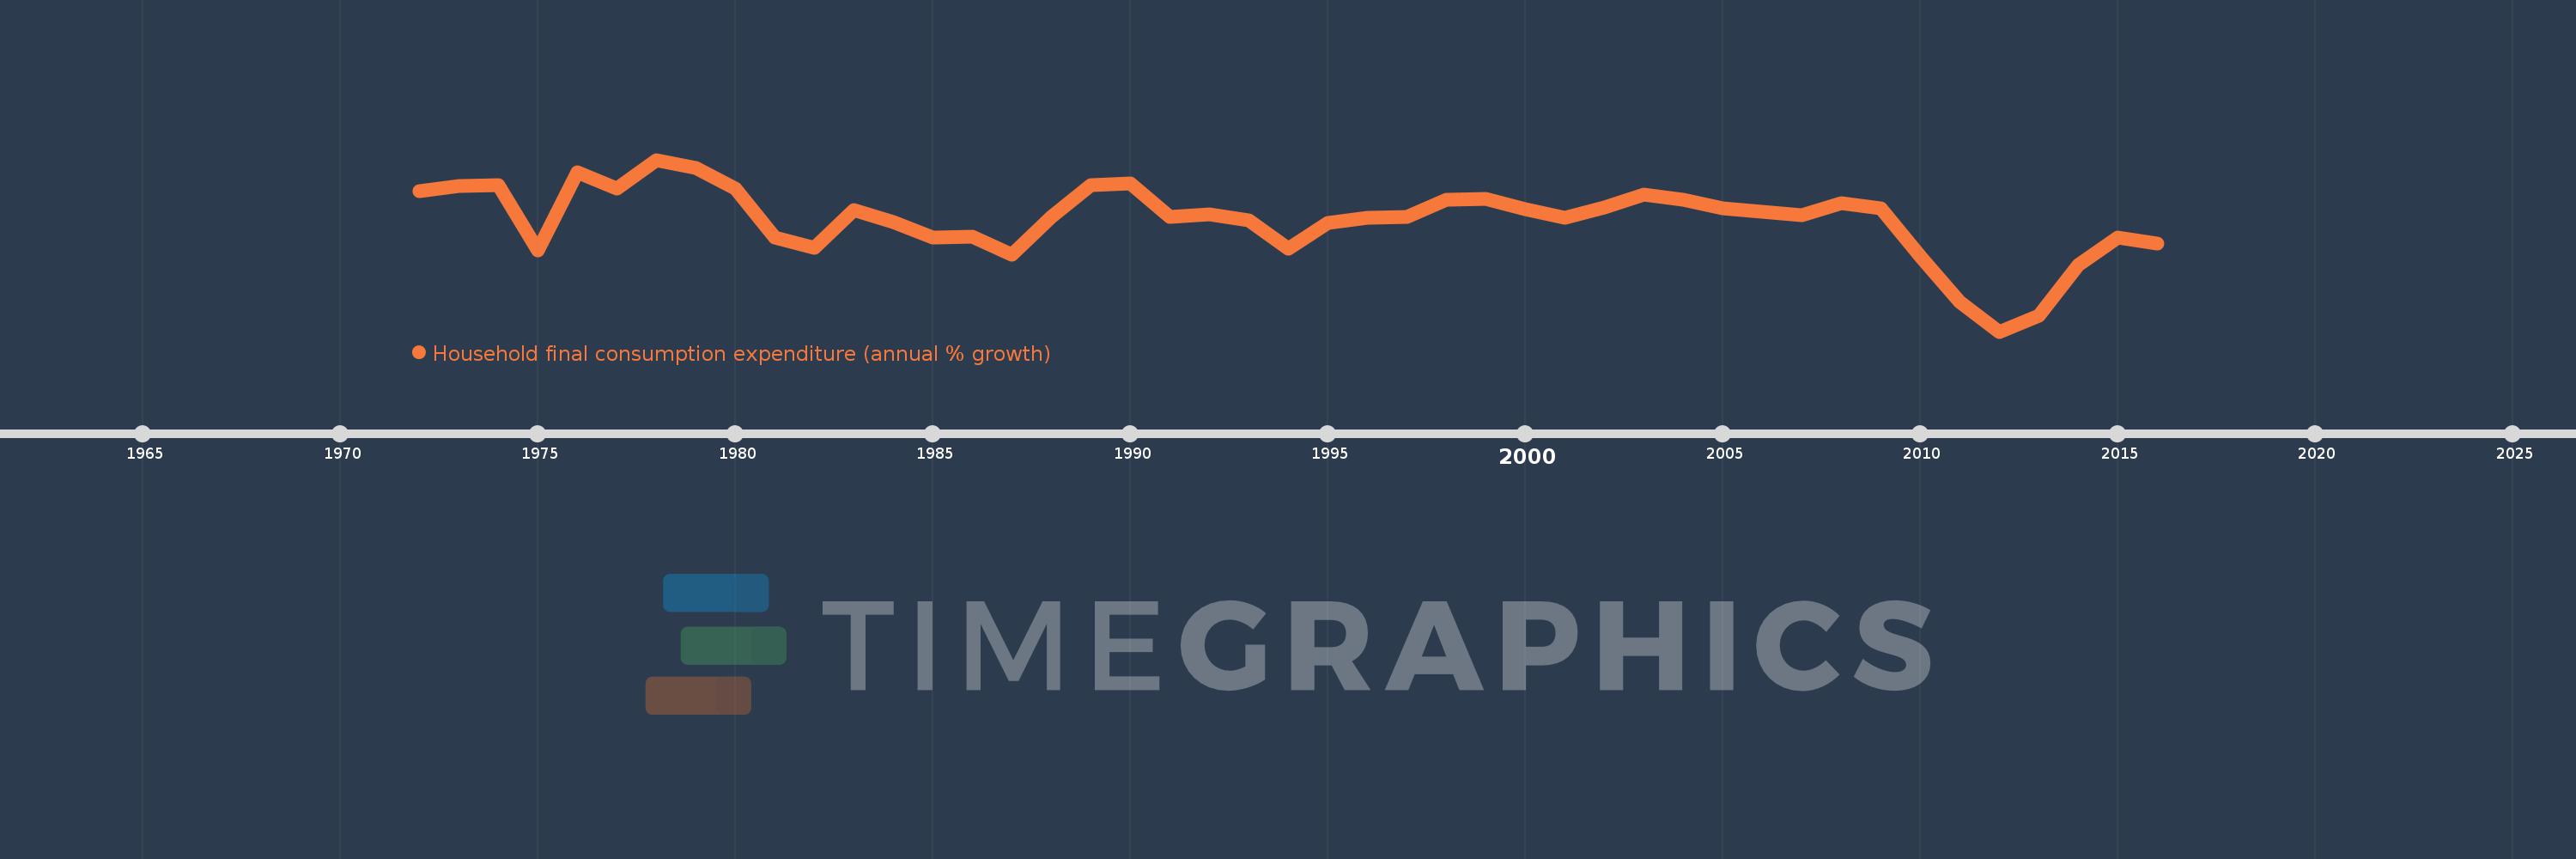
Household final consumption expenditure (annual % growth)
2016,2015,2014,2013,2012,2011,2010,2009,2008,2007,2006,2005,2004,2003,2002,2001,2000,1999,1998,1997,1996,1995,1994,1993,1992,1991,1990,1989,1988,1987,1986,1985,1984,1983,1982,1981,1980,1979,1978,1977,1976,1975,1974,1973,1972
Estas estatísticas em outros países:
AlbaniaAlgeriaAntigua and BarbudaArab WorldArgentinaArmeniaAustraliaAustriaAzerbaijanBahamas, TheBahrainBangladeshBarbadosBelarusBelgiumBelizeBeninBhutanBoliviaBosnia and HerzegovinaBotswanaBrazilBrunei DarussalamBulgariaBurkina FasoBurundiCabo VerdeCambodiaCameroonCanadaCaribbean small statesCentral Europe and the BalticsChadChileChinaColombiaComorosCongo, Dem. Rep.Congo, Rep.Costa RicaCote d'IvoireCroatiaCubaCyprusCzech RepublicDenmarkDominican RepublicEarly-demographic dividendEast Asia & PacificEast Asia & Pacific (excluding high income)East Asia & Pacific (IDA & IBRD countries)EcuadorEgypt, Arab Rep.El SalvadorEquatorial GuineaEritreaEstoniaEthiopiaEuro areaEurope & Central AsiaEurope & Central Asia (excluding high income)Europe & Central Asia (IDA & IBRD countries)European UnionFinlandFranceGabonGambia, TheGeorgiaGermanyGhanaGreeceGuatemalaGuineaGuinea-BissauHaitiHeavily indebted poor countries (HIPC)High incomeHondurasHong Kong SAR, ChinaHungaryIBRD onlyIcelandIDA & IBRD totalIDA blendIDA onlyIDA totalIndiaIndonesiaIran, Islamic Rep.IrelandIsraelItalyJamaicaJapanJordanKazakhstanKenyaKorea, Rep.KosovoKuwaitKyrgyz RepublicLao PDRLate-demographic dividendLatin America & Caribbean Latin America & Caribbean (excluding high income)Latin America & the Caribbean (IDA & IBRD countries)LatviaLeast developed countries: UN classificationLebanonLiberiaLithuaniaLow & middle incomeLow incomeLower middle incomeLuxembourgMacao SAR, ChinaMacedonia, FYRMadagascarMalawiMalaysiaMaliMaltaMauritaniaMauritiusMexicoMiddle East & North AfricaMiddle East & North Africa (excluding high income)Middle East & North Africa (IDA & IBRD countries)Middle incomeMoldovaMongoliaMontenegroMoroccoMozambiqueNamibiaNepalNetherlandsNew ZealandNicaraguaNigerNigeriaNorth AmericaNorwayOECD membersOmanOther small statesPakistanPanamaPapua New GuineaParaguayPeruPhilippinesPolandPortugalPost-demographic dividendPre-demographic dividendPuerto RicoQatarRomaniaRussian FederationRwandaSaudi ArabiaSenegalSerbiaSeychellesSierra LeoneSingaporeSlovak RepublicSloveniaSmall statesSomaliaSouth AfricaSouth AsiaSouth Asia (IDA & IBRD)South SudanSpainSri LankaSub-Saharan Africa Sub-Saharan Africa (excluding high income)Sub-Saharan Africa (IDA & IBRD countries)SudanSurinameSwazilandSwedenSwitzerlandSyrian Arab RepublicTajikistanTanzaniaThailandTimor-LesteTogoTrinidad and TobagoTunisiaTurkeyTurkmenistanUgandaUkraineUnited Arab EmiratesUnited KingdomUnited StatesUpper middle incomeUruguayVanuatuVenezuela, RBVietnamWest Bank and GazaWorldZimbabwe Linha do tempo:
Nesta escala de tempo está apresentado um gráfico de 1972 ano até 2016 ano Greece. Dados de 1971 ano ausente. O número de observações reais por data: 45.
Fonte (nome):
Indicadores de desenvolvimento mundial
Fonte (organização):
World Bank national accounts data, and OECD National Accounts data files.
Categorias:
Economy & Growth
Foi atualizado:
23 abr 2017 ano
Indicadores de alterações dos valores ao longo dos anos
Mínimo:
-9.748
1 jan 2012 ano
Máximo:
8.806
1 jan 1978 ano
Na data de observação
Valor
Mudança absoluta
A alteração em relação ao valor anterior
1 jan 1972 ano
5.41
+5.41
0.0%
1 jan 1973 ano
6.007
+0.597
11.04%
1 jan 1974 ano
6.098
+0.091
1.52%
1 jan 1975 ano
-1.004
-7.102
-116.46%
1 jan 1976 ano
7.472
+8.476
-844.42%
1 jan 1977 ano
5.708
-1.764
-23.61%
1 jan 1978 ano
8.806
+3.098
54.28%
1 jan 1979 ano
7.911
-0.894
-10.16%
1 jan 1980 ano
5.734
-2.177
-27.51%
1 jan 1981 ano
0.455
-5.28
-92.07%
1 jan 1982 ano
-0.684
-1.139
-250.35%
1 jan 1983 ano
3.39
+4.073
-595.62%
1 jan 1984 ano
2.097
-1.293
-38.13%
1 jan 1985 ano
0.382
-1.715
-81.79%
1 jan 1986 ano
0.511
+0.129
33.77%
1 jan 1987 ano
-1.481
-1.992
-389.89%
1 jan 1988 ano
2.665
+4.146
-279.93%
1 jan 1989 ano
6.056
+3.391
127.26%
1 jan 1990 ano
6.285
+0.229
3.78%
1 jan 1991 ano
2.619
-3.666
-58.33%
1 jan 1992 ano
2.89
+0.271
10.34%
1 jan 1993 ano
2.273
-0.617
-21.35%
1 jan 1994 ano
-0.765
-3.038
-133.66%
1 jan 1995 ano
1.945
+2.71
-354.21%
1 jan 1996 ano
2.523
+0.578
29.73%
1 jan 1997 ano
2.675
+0.152
6.01%
1 jan 1998 ano
4.462
+1.787
66.8%
1 jan 1999 ano
4.566
+0.104
2.34%
1 jan 2000 ano
3.497
-1.069
-23.41%
1 jan 2001 ano
2.523
-0.974
-27.85%
1 jan 2002 ano
3.624
+1.1
43.6%
1 jan 2003 ano
5.085
+1.462
40.34%
1 jan 2004 ano
4.533
-0.552
-10.86%
1 jan 2005 ano
3.607
-0.926
-20.43%
1 jan 2006 ano
3.225
-0.382
-10.59%
1 jan 2007 ano
2.782
-0.443
-13.74%
1 jan 2008 ano
4.076
+1.294
46.53%
1 jan 2009 ano
3.584
-0.492
-12.08%
1 jan 2010 ano
-1.67
-5.254
-146.6%
1 jan 2011 ano
-6.519
-4.849
290.33%
1 jan 2012 ano
-9.748
-3.229
49.53%
1 jan 2013 ano
-8.023
+1.725
-17.69%
1 jan 2014 ano
-2.569
+5.454
-67.98%
1 jan 2015 ano
0.421
+2.99
-116.4%
1 jan 2016 ano
-0.218
-0.639
-151.76%
Classificação de países por estatísticas atuais por anos


Comentários: