29
/pt/
pt
AIzaSyAYiBZKx7MnpbEhh9jyipgxe19OcubqV5w
April 1, 2024
140859
Ghana
GHA
true
2
1
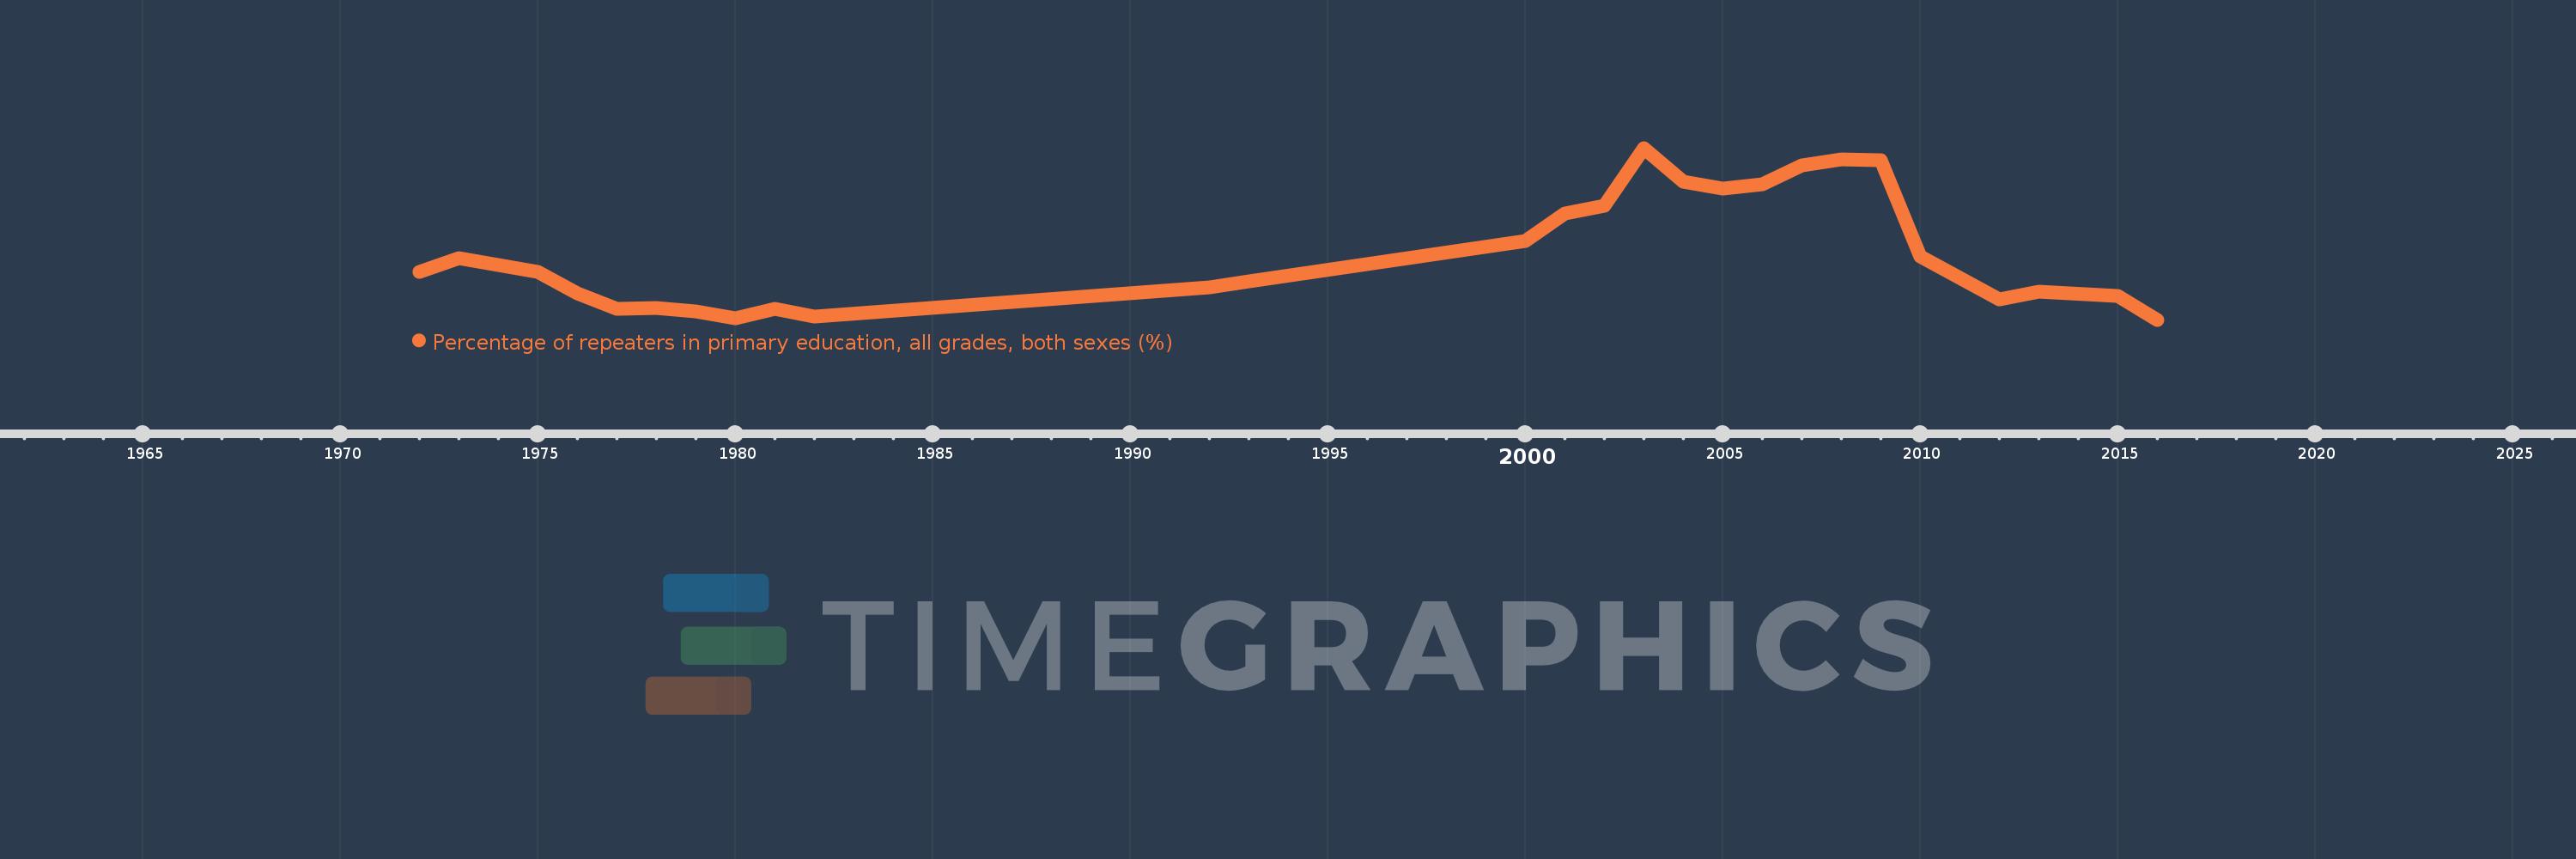
Percentage of repeaters in primary education, all grades, both sexes (%)
2016,2015,2013,2012,2010,2009,2008,2007,2006,2005,2004,2003,2002,2001,2000,1993,1992,1982,1981,1980,1979,1978,1977,1976,1975,1973,1972
Estas estatísticas em outros países:
AfghanistanAlbaniaAlgeriaAndorraAngolaAntigua and BarbudaArab WorldArgentinaArmeniaArubaAustriaAzerbaijanBahamas, TheBahrainBangladeshBelarusBelgiumBelizeBeninBermudaBhutanBoliviaBosnia and HerzegovinaBotswanaBrazilBritish Virgin IslandsBrunei DarussalamBulgariaBurkina FasoBurundiCabo VerdeCambodiaCameroonCanadaCaribbean small statesCayman IslandsCentral African RepublicCentral Europe and the BalticsChadChileChinaColombiaComorosCongo, Dem. Rep.Congo, Rep.Costa RicaCote d'IvoireCroatiaCubaCyprusCzech RepublicDenmarkDjiboutiDominicaDominican RepublicEarly-demographic dividendEast Asia & PacificEast Asia & Pacific (excluding high income)East Asia & Pacific (IDA & IBRD countries)EcuadorEgypt, Arab Rep.El SalvadorEquatorial GuineaEritreaEstoniaEthiopiaEuro areaEurope & Central AsiaEurope & Central Asia (excluding high income)Europe & Central Asia (IDA & IBRD countries)European UnionFijiFinlandFragile and conflict affected situationsFranceGabonGambia, TheGeorgiaGermanyGhanaGreeceGrenadaGuatemalaGuineaGuinea-BissauGuyanaHaitiHeavily indebted poor countries (HIPC)High incomeHondurasHong Kong SAR, ChinaHungaryIBRD onlyIcelandIDA & IBRD totalIDA blendIDA onlyIDA totalIndiaIndonesiaIran, Islamic Rep.IraqIrelandIsraelItalyJamaicaJapanJordanKazakhstanKenyaKiribatiKorea, Rep.KuwaitKyrgyz RepublicLao PDRLate-demographic dividendLatin America & Caribbean Latin America & Caribbean (excluding high income)Latin America & the Caribbean (IDA & IBRD countries)LatviaLeast developed countries: UN classificationLebanonLesothoLiberiaLibyaLiechtensteinLithuaniaLow & middle incomeLow incomeLower middle incomeLuxembourgMacao SAR, ChinaMacedonia, FYRMadagascarMalawiMalaysiaMaldivesMaliMaltaMauritaniaMauritiusMexicoMiddle East & North AfricaMiddle East & North Africa (excluding high income)Middle East & North Africa (IDA & IBRD countries)Middle incomeMoldovaMonacoMongoliaMontenegroMoroccoMozambiqueMyanmarNamibiaNauruNepalNetherlandsNew ZealandNicaraguaNigerNorwayOECD membersOmanOther small statesPacific island small statesPakistanPalauPanamaPapua New GuineaParaguayPeruPhilippinesPolandPortugalPost-demographic dividendPre-demographic dividendQatarRomaniaRussian FederationRwandaSamoaSan MarinoSao Tome and PrincipeSaudi ArabiaSenegalSerbiaSeychellesSierra LeoneSingaporeSint Maarten (Dutch part)Slovak RepublicSloveniaSmall statesSolomon IslandsSomaliaSouth AfricaSouth AsiaSouth Asia (IDA & IBRD)South SudanSpainSri LankaSt. Kitts and NevisSt. LuciaSt. Vincent and the GrenadinesSub-Saharan Africa Sub-Saharan Africa (excluding high income)Sub-Saharan Africa (IDA & IBRD countries)SudanSurinameSwazilandSwedenSwitzerlandSyrian Arab RepublicTajikistanTanzaniaThailandTimor-LesteTogoTongaTrinidad and TobagoTunisiaTurkeyTurks and Caicos IslandsTuvaluUgandaUkraineUnited Arab EmiratesUnited KingdomUpper middle incomeUruguayUzbekistanVanuatuVenezuela, RBVietnamWest Bank and GazaWorldYemen, Rep.ZambiaZimbabwe Linha do tempo:
Nesta escala de tempo está apresentado um gráfico de 1972 ano até 2016 ano Ghana. Dados de 1971 ano ausente. O número de observações reais por data: 27.
Fonte (nome):
Indicadores de desenvolvimento mundial
Fonte (organização):
UNESCO Institute for Statistics
Categorias:
Education
Foi atualizado:
23 abr 2017 ano
Indicadores de alterações dos valores ao longo dos anos
Mínimo:
1.974
1 jan 2016 ano
Máximo:
6.856
1 jan 2003 ano
Na data de observação
Valor
Mudança absoluta
A alteração em relação ao valor anterior
1 jan 1972 ano
3.328
+3.328
0.0%
1 jan 1973 ano
3.726
+0.398
11.97%
1 jan 1975 ano
3.341
-0.385
-10.33%
1 jan 1976 ano
2.729
-0.612
-18.32%
1 jan 1977 ano
2.275
-0.454
-16.63%
1 jan 1978 ano
2.317
+0.042
1.86%
1 jan 1979 ano
2.218
-0.099
-4.26%
1 jan 1980 ano
2.019
-0.199
-8.99%
1 jan 1981 ano
2.277
+0.258
12.77%
1 jan 1982 ano
2.063
-0.214
-9.39%
1 jan 1992 ano
2.895
+0.832
40.34%
1 jan 1993 ano
3.074
+0.179
6.2%
1 jan 2000 ano
4.203
+1.128
36.69%
1 jan 2001 ano
4.994
+0.791
18.83%
1 jan 2002 ano
5.211
+0.217
4.35%
1 jan 2003 ano
6.856
+1.645
31.57%
1 jan 2004 ano
5.895
-0.961
-14.01%
1 jan 2005 ano
5.701
-0.194
-3.29%
1 jan 2006 ano
5.829
+0.128
2.25%
1 jan 2007 ano
6.358
+0.529
9.07%
1 jan 2008 ano
6.522
+0.163
2.57%
1 jan 2009 ano
6.51
-0.012
-0.19%
1 jan 2010 ano
3.774
-2.736
-42.02%
1 jan 2012 ano
2.545
-1.229
-32.56%
1 jan 2013 ano
2.768
+0.223
8.76%
1 jan 2015 ano
2.655
-0.113
-4.1%
1 jan 2016 ano
1.974
-0.681
-25.65%
Classificação de países por estatísticas atuais por anos


Comentários: