29
/pt/
pt
AIzaSyAYiBZKx7MnpbEhh9jyipgxe19OcubqV5w
April 1, 2024
136824
Gambia, The
GMB
true
2
1
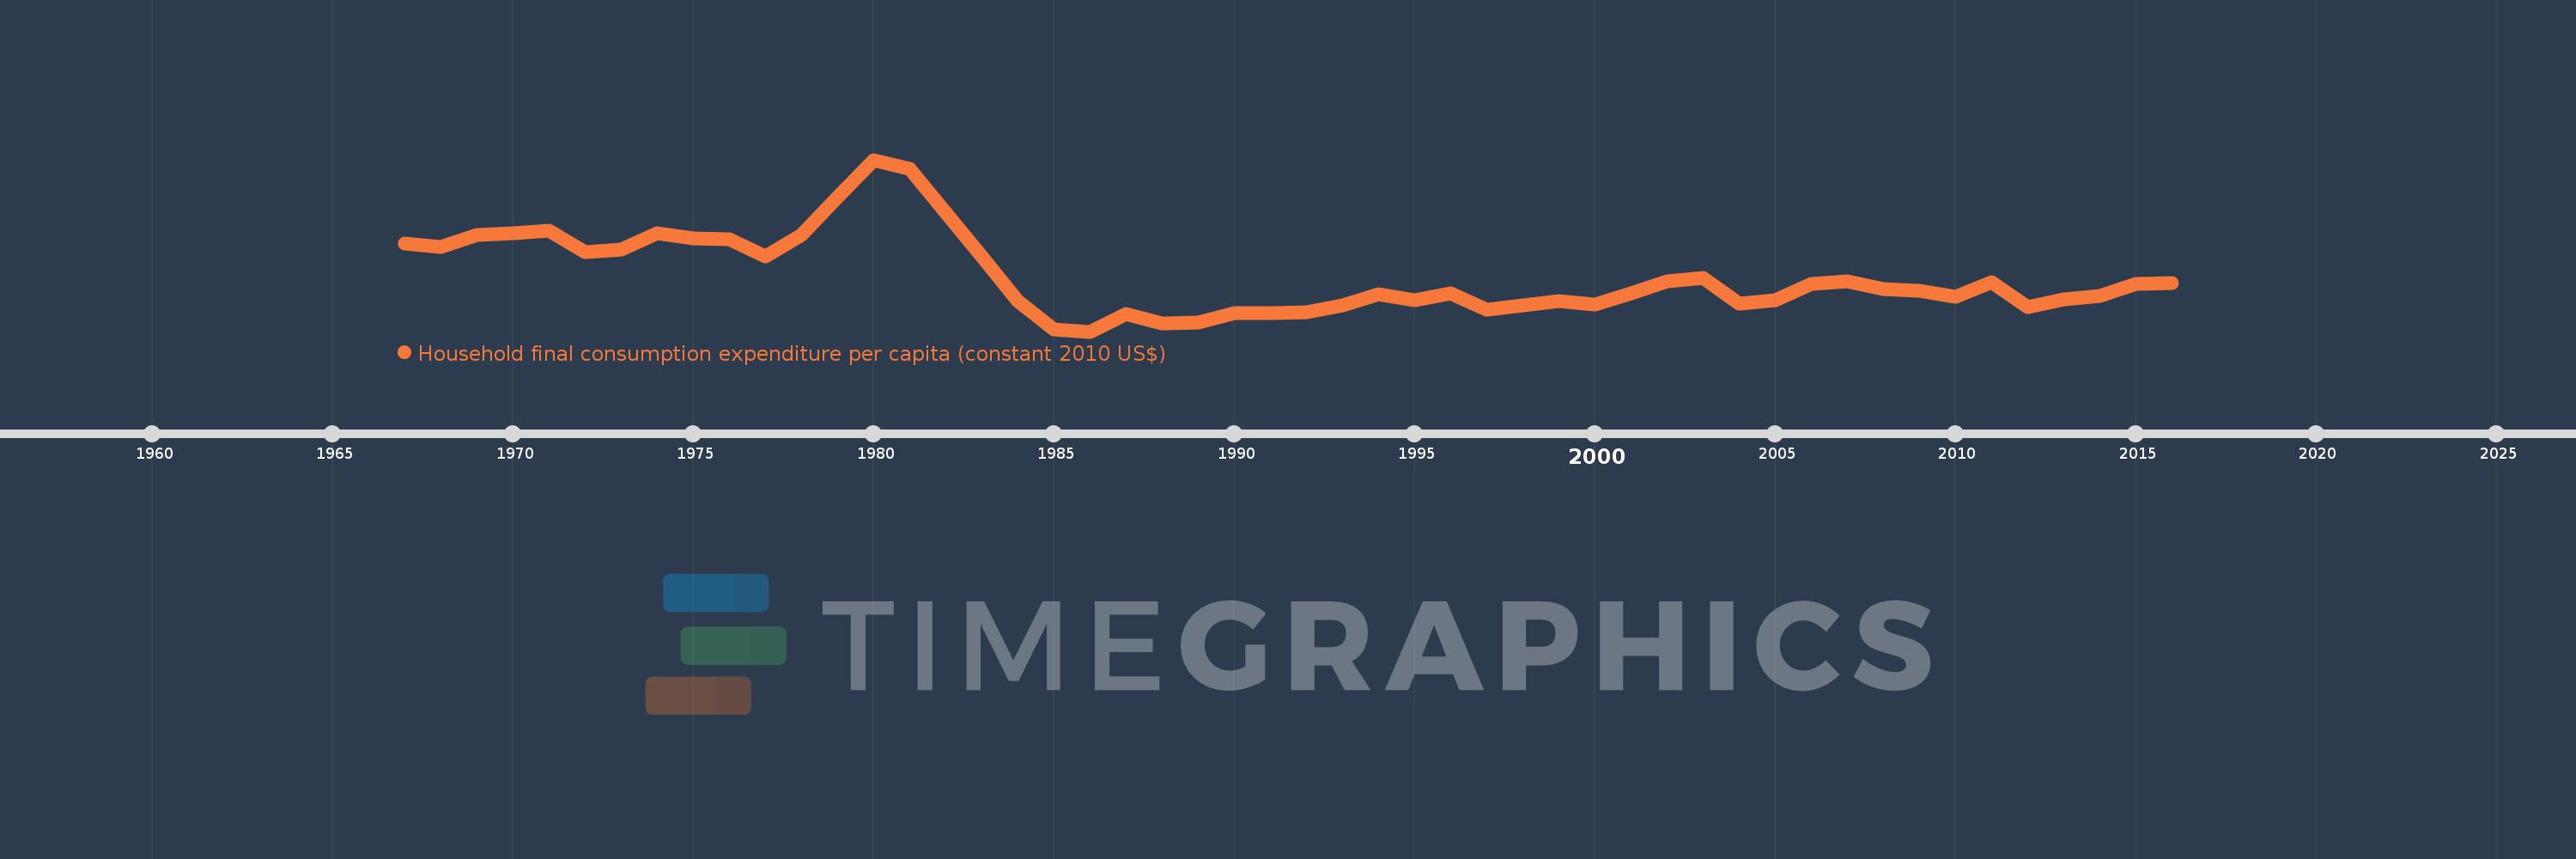
Household final consumption expenditure per capita (constant 2010 US$)
2016,2015,2014,2013,2012,2011,2010,2009,2008,2007,2006,2005,2004,2003,2002,2001,2000,1999,1998,1997,1996,1995,1994,1993,1992,1991,1990,1989,1988,1987,1986,1985,1984,1983,1982,1981,1980,1979,1978,1977,1976,1975,1974,1973,1972,1971,1970,1969,1968,1967
Estas estatísticas em outros países:
AfghanistanAlbaniaAlgeriaAngolaAntigua and BarbudaArab WorldArgentinaArmeniaArubaAustraliaAustriaAzerbaijanBahamas, TheBahrainBangladeshBarbadosBelarusBelgiumBelizeBeninBermudaBhutanBoliviaBosnia and HerzegovinaBotswanaBrazilBrunei DarussalamBulgariaBurkina FasoBurundiCabo VerdeCambodiaCameroonCanadaCaribbean small statesCentral African RepublicCentral Europe and the BalticsChadChileChinaColombiaComorosCongo, Dem. Rep.Congo, Rep.Costa RicaCote d'IvoireCroatiaCubaCyprusCzech RepublicDenmarkDominicaDominican RepublicEarly-demographic dividendEast Asia & PacificEast Asia & Pacific (excluding high income)East Asia & Pacific (IDA & IBRD countries)EcuadorEgypt, Arab Rep.El SalvadorEquatorial GuineaEritreaEstoniaEuro areaEurope & Central AsiaEurope & Central Asia (excluding high income)Europe & Central Asia (IDA & IBRD countries)European UnionFaroe IslandsFinlandFranceGabonGambia, TheGeorgiaGermanyGhanaGreeceGrenadaGuatemalaGuineaGuinea-BissauGuyanaHaitiHeavily indebted poor countries (HIPC)High incomeHondurasHong Kong SAR, ChinaHungaryIBRD onlyIcelandIDA & IBRD totalIDA blendIDA onlyIDA totalIndiaIndonesiaIran, Islamic Rep.IrelandIsraelItalyJamaicaJapanJordanKazakhstanKenyaKorea, Rep.KosovoKuwaitKyrgyz RepublicLao PDRLate-demographic dividendLatin America & Caribbean Latin America & Caribbean (excluding high income)Latin America & the Caribbean (IDA & IBRD countries)LatviaLeast developed countries: UN classificationLebanonLiberiaLithuaniaLow & middle incomeLow incomeLower middle incomeLuxembourgMacao SAR, ChinaMacedonia, FYRMadagascarMalawiMalaysiaMaliMaltaMauritaniaMauritiusMexicoMiddle East & North AfricaMiddle East & North Africa (excluding high income)Middle East & North Africa (IDA & IBRD countries)Middle incomeMoldovaMongoliaMontenegroMoroccoMozambiqueNamibiaNepalNetherlandsNew ZealandNicaraguaNigerNigeriaNorth AmericaNorwayOECD membersOmanOther small statesPakistanPanamaParaguayPeruPhilippinesPolandPortugalPost-demographic dividendPre-demographic dividendPuerto RicoQatarRomaniaRussian FederationRwandaSaudi ArabiaSenegalSerbiaSeychellesSierra LeoneSingaporeSlovak RepublicSloveniaSmall statesSouth AfricaSouth AsiaSouth Asia (IDA & IBRD)South SudanSpainSri LankaSt. Kitts and NevisSt. LuciaSt. Vincent and the GrenadinesSub-Saharan Africa Sub-Saharan Africa (excluding high income)Sub-Saharan Africa (IDA & IBRD countries)SudanSurinameSwazilandSwedenSwitzerlandTajikistanTanzaniaThailandTimor-LesteTogoTongaTrinidad and TobagoTunisiaTurkeyTurkmenistanUgandaUkraineUnited Arab EmiratesUnited KingdomUnited StatesUpper middle incomeUruguayUzbekistanVanuatuVenezuela, RBVietnamWest Bank and GazaWorldYemen, Rep.ZambiaZimbabwe Linha do tempo:
Nesta escala de tempo está apresentado um gráfico de 1967 ano até 2016 ano Gambia, The. Dados de 1966 ano ausente. O número de observações reais por data: 50.
Fonte (nome):
Indicadores de desenvolvimento mundial
Fonte (organização):
World Bank national accounts data, and OECD National Accounts data files.
Categorias:
Economy & Growth
Foi atualizado:
23 abr 2017 ano
Indicadores de alterações dos valores ao longo dos anos
Mínimo:
341.842
1 jan 1986 ano
Máximo:
844.33
1 jan 1980 ano
Na data de observação
Valor
Mudança absoluta
A alteração em relação ao valor anterior
1 jan 1967 ano
599.881
+599.881
0.0%
1 jan 1968 ano
588.124
-11.757
-1.96%
1 jan 1969 ano
624.119
+35.996
6.12%
1 jan 1970 ano
629.841
+5.721
0.92%
1 jan 1971 ano
636.499
+6.658
1.06%
1 jan 1972 ano
574.839
-61.659
-9.69%
1 jan 1973 ano
582.118
+7.279
1.27%
1 jan 1974 ano
630.551
+48.433
8.32%
1 jan 1975 ano
615.655
-14.896
-2.36%
1 jan 1976 ano
612.48
-3.175
-0.52%
1 jan 1977 ano
562.927
-49.553
-8.09%
1 jan 1978 ano
623.773
+60.846
10.81%
1 jan 1979 ano
735.73
+111.958
17.95%
1 jan 1980 ano
844.33
+108.599
14.76%
1 jan 1981 ano
818.76
-25.57
-3.03%
1 jan 1982 ano
689.188
-129.572
-15.83%
1 jan 1983 ano
561.306
-127.882
-18.56%
1 jan 1984 ano
431.463
-129.843
-23.13%
1 jan 1985 ano
348.833
-82.63
-19.15%
1 jan 1986 ano
341.842
-6.991
-2.0%
1 jan 1987 ano
393.19
+51.348
15.02%
1 jan 1988 ano
366.214
-26.975
-6.86%
1 jan 1989 ano
369.329
+3.114
0.85%
1 jan 1990 ano
395.776
+26.447
7.16%
1 jan 1991 ano
396.753
+0.977
0.25%
1 jan 1992 ano
397.202
+0.449
0.11%
1 jan 1993 ano
418.781
+21.579
5.43%
1 jan 1994 ano
452.371
+33.59
8.02%
1 jan 1995 ano
434.186
-18.185
-4.02%
1 jan 1996 ano
453.748
+19.562
4.51%
1 jan 1997 ano
405.766
-47.982
-10.57%
1 jan 1998 ano
419.412
+13.646
3.36%
1 jan 1999 ano
430.068
+10.655
2.54%
1 jan 2000 ano
420.666
-9.402
-2.19%
1 jan 2001 ano
452.925
+32.259
7.67%
1 jan 2002 ano
489.001
+36.076
7.97%
1 jan 2003 ano
498.469
+9.468
1.94%
1 jan 2004 ano
423.806
-74.663
-14.98%
1 jan 2005 ano
434.308
+10.503
2.48%
1 jan 2006 ano
480.794
+46.485
10.7%
1 jan 2007 ano
488.864
+8.07
1.68%
1 jan 2008 ano
467.169
-21.695
-4.44%
1 jan 2009 ano
461.426
-5.743
-1.23%
1 jan 2010 ano
443.865
-17.561
-3.81%
1 jan 2011 ano
485.657
+41.792
9.42%
1 jan 2012 ano
413.306
-72.351
-14.9%
1 jan 2013 ano
437.148
+23.842
5.77%
1 jan 2014 ano
445.508
+8.36
1.91%
1 jan 2015 ano
480.476
+34.968
7.85%
1 jan 2016 ano
484.573
+4.097
0.85%
Classificação de países por estatísticas atuais por anos


Comentários: