29
/pt/
pt
AIzaSyAYiBZKx7MnpbEhh9jyipgxe19OcubqV5w
April 1, 2024
133180
Finland
FIN
true
2
1
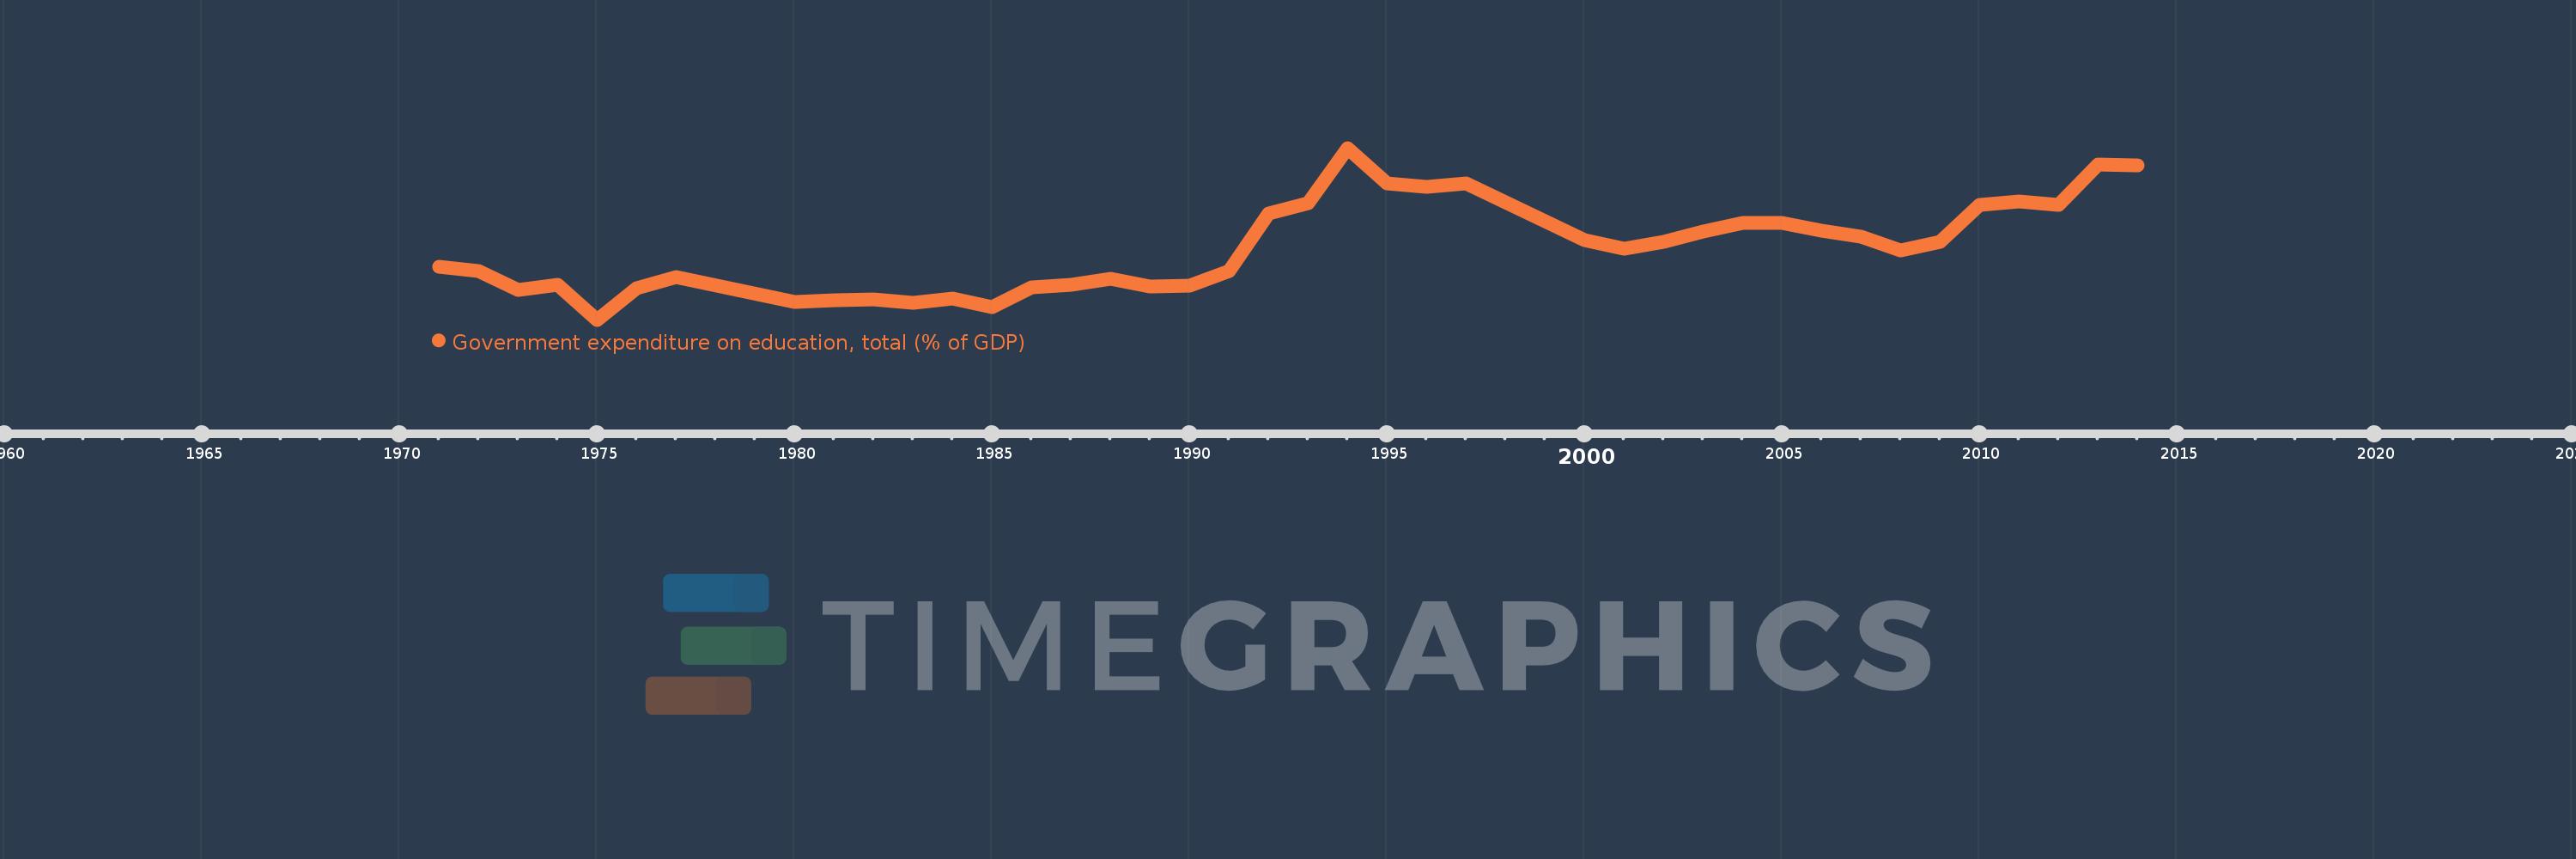
Government expenditure on education, total (% of GDP)
2014,2013,2012,2011,2010,2009,2008,2007,2006,2005,2004,2003,2002,2001,2000,1997,1996,1995,1994,1993,1992,1991,1990,1989,1988,1987,1986,1985,1984,1983,1982,1981,1980,1977,1976,1975,1974,1973,1972,1971
Estas estatísticas em outros países:
AfghanistanAlbaniaAlgeriaAndorraAngolaAntigua and BarbudaArab WorldArgentinaArmeniaArubaAustraliaAustriaAzerbaijanBahamas, TheBahrainBangladeshBarbadosBelarusBelgiumBelizeBeninBermudaBhutanBoliviaBotswanaBrazilBritish Virgin IslandsBrunei DarussalamBulgariaBurkina FasoBurundiCabo VerdeCambodiaCameroonCanadaCaribbean small statesCentral African RepublicCentral Europe and the BalticsChadChileChinaColombiaComorosCongo, Dem. Rep.Congo, Rep.Costa RicaCote d'IvoireCroatiaCubaCuracaoCyprusCzech RepublicDenmarkDjiboutiDominicaDominican RepublicEarly-demographic dividendEast Asia & PacificEast Asia & Pacific (excluding high income)East Asia & Pacific (IDA & IBRD countries)EcuadorEgypt, Arab Rep.El SalvadorEquatorial GuineaEritreaEstoniaEthiopiaEuro areaEurope & Central AsiaEurope & Central Asia (excluding high income)Europe & Central Asia (IDA & IBRD countries)European UnionFijiFinlandFranceGabonGambia, TheGeorgiaGermanyGhanaGreeceGrenadaGuatemalaGuineaGuinea-BissauGuyanaHaitiHeavily indebted poor countries (HIPC)High incomeHondurasHong Kong SAR, ChinaHungaryIBRD onlyIcelandIDA & IBRD totalIDA blendIDA onlyIDA totalIndiaIndonesiaIran, Islamic Rep.IraqIrelandIsraelItalyJamaicaJapanJordanKazakhstanKenyaKiribatiKorea, Rep.KuwaitKyrgyz RepublicLao PDRLate-demographic dividendLatin America & Caribbean Latin America & Caribbean (excluding high income)Latin America & the Caribbean (IDA & IBRD countries)LatviaLeast developed countries: UN classificationLebanonLesothoLiberiaLibyaLiechtensteinLithuaniaLow & middle incomeLow incomeLower middle incomeLuxembourgMacao SAR, ChinaMacedonia, FYRMadagascarMalawiMalaysiaMaldivesMaliMaltaMarshall IslandsMauritaniaMauritiusMexicoMicronesia, Fed. Sts.Middle East & North AfricaMiddle East & North Africa (excluding high income)Middle East & North Africa (IDA & IBRD countries)Middle incomeMoldovaMonacoMongoliaMoroccoMozambiqueMyanmarNamibiaNepalNetherlandsNew ZealandNicaraguaNigerNigeriaNorth AmericaNorwayOECD membersOmanOther small statesPakistanPalauPanamaPapua New GuineaParaguayPeruPhilippinesPolandPortugalPost-demographic dividendPre-demographic dividendPuerto RicoQatarRomaniaRussian FederationRwandaSamoaSan MarinoSao Tome and PrincipeSaudi ArabiaSenegalSerbiaSeychellesSierra LeoneSingaporeSlovak RepublicSloveniaSmall statesSolomon IslandsSomaliaSouth AfricaSouth AsiaSouth Asia (IDA & IBRD)South SudanSpainSri LankaSt. Kitts and NevisSt. LuciaSt. Vincent and the GrenadinesSub-Saharan Africa Sub-Saharan Africa (excluding high income)Sub-Saharan Africa (IDA & IBRD countries)SudanSwazilandSwedenSwitzerlandSyrian Arab RepublicTajikistanTanzaniaThailandTimor-LesteTogoTongaTrinidad and TobagoTunisiaTurkeyTurkmenistanTurks and Caicos IslandsTuvaluUgandaUkraineUnited Arab EmiratesUnited KingdomUnited StatesUpper middle incomeUruguayVanuatuVenezuela, RBVietnamWorldYemen, Rep.ZambiaZimbabwe Linha do tempo:
Nesta escala de tempo está apresentado um gráfico de 1971 ano até 2014 ano Finland. Dados de 1970 ano ausente. O número de observações reais por data: 40.
Fonte (nome):
Indicadores de desenvolvimento mundial
Fonte (organização):
United Nations Educational, Scientific, and Cultural Organization (UNESCO) Institute for Statistics.
Categorias:
Education
Foi atualizado:
23 abr 2017 ano
Indicadores de alterações dos valores ao longo dos anos
Mínimo:
4.479
1 jan 1975 ano
Máximo:
7.484
1 jan 1994 ano
Na data de observação
Valor
Mudança absoluta
A alteração em relação ao valor anterior
1 jan 1971 ano
5.409
+5.409
0.0%
1 jan 1972 ano
5.327
-0.082
-1.52%
1 jan 1973 ano
5.004
-0.323
-6.06%
1 jan 1974 ano
5.09
+0.085
1.7%
1 jan 1975 ano
4.479
-0.611
-12.0%
1 jan 1976 ano
5.029
+0.551
12.29%
1 jan 1977 ano
5.224
+0.195
3.88%
1 jan 1980 ano
4.793
-0.431
-8.25%
1 jan 1981 ano
4.822
+0.029
0.6%
1 jan 1982 ano
4.83
+0.008
0.16%
1 jan 1983 ano
4.776
-0.054
-1.11%
1 jan 1984 ano
4.852
+0.076
1.58%
1 jan 1985 ano
4.696
-0.156
-3.22%
1 jan 1986 ano
5.042
+0.346
7.38%
1 jan 1987 ano
5.097
+0.055
1.08%
1 jan 1988 ano
5.198
+0.102
1.99%
1 jan 1989 ano
5.065
-0.133
-2.56%
1 jan 1990 ano
5.07
+0.005
0.11%
1 jan 1991 ano
5.336
+0.266
5.24%
1 jan 1992 ano
6.333
+0.997
18.68%
1 jan 1993 ano
6.515
+0.182
2.88%
1 jan 1994 ano
7.484
+0.969
14.87%
1 jan 1995 ano
6.856
-0.628
-8.39%
1 jan 1996 ano
6.809
-0.046
-0.67%
1 jan 1997 ano
6.861
+0.051
0.75%
1 jan 2000 ano
5.87
-0.991
-14.44%
1 jan 2001 ano
5.717
-0.153
-2.6%
1 jan 2002 ano
5.848
+0.131
2.29%
1 jan 2003 ano
6.025
+0.177
3.02%
1 jan 2004 ano
6.175
+0.15
2.49%
1 jan 2005 ano
6.168
-0.006
-0.1%
1 jan 2006 ano
6.036
-0.132
-2.15%
1 jan 2007 ano
5.938
-0.098
-1.62%
1 jan 2008 ano
5.686
-0.252
-4.24%
1 jan 2009 ano
5.847
+0.161
2.83%
1 jan 2010 ano
6.485
+0.638
10.92%
1 jan 2011 ano
6.541
+0.056
0.86%
1 jan 2012 ano
6.482
-0.059
-0.9%
1 jan 2013 ano
7.193
+0.711
10.96%
1 jan 2014 ano
7.179
-0.013
-0.18%
Classificação de países por estatísticas atuais por anos


Comentários: