29
/pt/
pt
AIzaSyAYiBZKx7MnpbEhh9jyipgxe19OcubqV5w
April 1, 2024
131779
Fiji
FJI
true
2
1
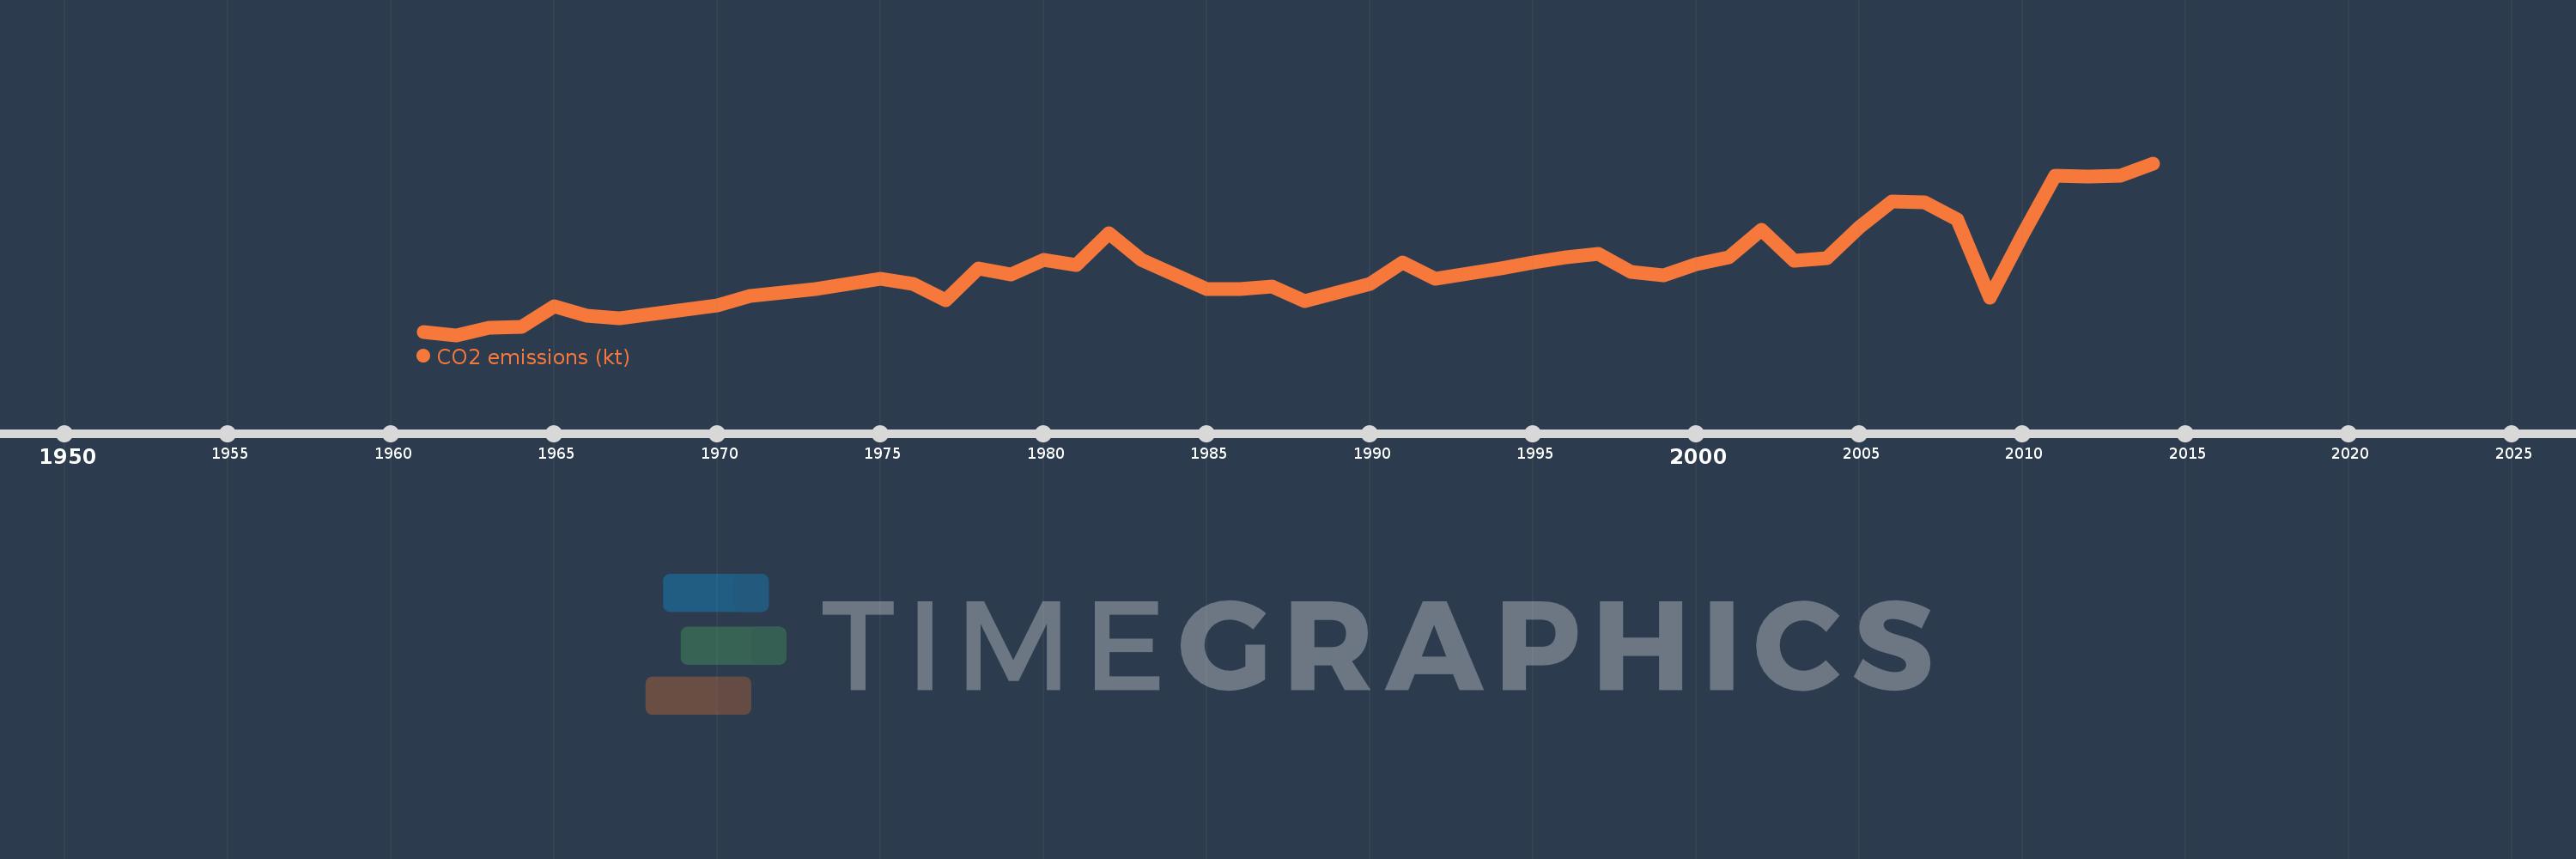
CO2 emissions (kt)
2014,2013,2012,2011,2010,2009,2008,2007,2006,2005,2004,2003,2002,2001,2000,1999,1998,1997,1996,1995,1994,1993,1992,1991,1990,1989,1988,1987,1986,1985,1984,1983,1982,1981,1980,1979,1978,1977,1976,1975,1974,1973,1972,1971,1970,1969,1968,1967,1966,1965,1964,1963,1962,1961
Estas estatísticas em outros países:
AfghanistanAlbaniaAlgeriaAndorraAngolaAntigua and BarbudaArab WorldArgentinaArmeniaArubaAustraliaAustriaAzerbaijanBahamas, TheBahrainBangladeshBarbadosBelarusBelgiumBelizeBeninBermudaBhutanBoliviaBosnia and HerzegovinaBotswanaBrazilBritish Virgin IslandsBrunei DarussalamBulgariaBurkina FasoBurundiCabo VerdeCambodiaCameroonCanadaCaribbean small statesCayman IslandsCentral African RepublicCentral Europe and the BalticsChadChileChinaColombiaComorosCongo, Dem. Rep.Congo, Rep.Costa RicaCote d'IvoireCroatiaCubaCuracaoCyprusCzech RepublicDenmarkDjiboutiDominicaDominican RepublicEarly-demographic dividendEast Asia & PacificEast Asia & Pacific (excluding high income)East Asia & Pacific (IDA & IBRD countries)EcuadorEgypt, Arab Rep.El SalvadorEquatorial GuineaEritreaEstoniaEthiopiaEuro areaEurope & Central AsiaEurope & Central Asia (excluding high income)Europe & Central Asia (IDA & IBRD countries)European UnionFaroe IslandsFijiFinlandFragile and conflict affected situationsFranceFrench PolynesiaGabonGambia, TheGeorgiaGermanyGhanaGibraltarGreeceGreenlandGrenadaGuatemalaGuineaGuinea-BissauGuyanaHaitiHeavily indebted poor countries (HIPC)High incomeHondurasHong Kong SAR, ChinaHungaryIBRD onlyIcelandIDA & IBRD totalIDA blendIDA onlyIDA totalIndiaIndonesiaIran, Islamic Rep.IraqIrelandIsraelItalyJamaicaJapanJordanKazakhstanKenyaKiribatiKorea, Dem. People’s Rep.Korea, Rep.KuwaitKyrgyz RepublicLao PDRLate-demographic dividendLatin America & Caribbean Latin America & Caribbean (excluding high income)Latin America & the Caribbean (IDA & IBRD countries)LatviaLeast developed countries: UN classificationLebanonLesothoLiberiaLibyaLiechtensteinLithuaniaLow & middle incomeLow incomeLower middle incomeLuxembourgMacao SAR, ChinaMacedonia, FYRMadagascarMalawiMalaysiaMaldivesMaliMaltaMarshall IslandsMauritaniaMauritiusMexicoMicronesia, Fed. Sts.Middle East & North AfricaMiddle East & North Africa (excluding high income)Middle East & North Africa (IDA & IBRD countries)Middle incomeMoldovaMongoliaMontenegroMoroccoMozambiqueMyanmarNamibiaNauruNepalNetherlandsNew CaledoniaNew ZealandNicaraguaNigerNigeriaNorth AmericaNorwayOECD membersOmanOther small statesPacific island small statesPakistanPalauPanamaPapua New GuineaParaguayPeruPhilippinesPolandPortugalPost-demographic dividendPre-demographic dividendQatarRomaniaRussian FederationRwandaSamoaSao Tome and PrincipeSaudi ArabiaSenegalSerbiaSeychellesSierra LeoneSingaporeSint Maarten (Dutch part)Slovak RepublicSloveniaSmall statesSolomon IslandsSomaliaSouth AfricaSouth AsiaSouth Asia (IDA & IBRD)South SudanSpainSri LankaSt. Kitts and NevisSt. LuciaSt. Vincent and the GrenadinesSub-Saharan Africa Sub-Saharan Africa (excluding high income)Sub-Saharan Africa (IDA & IBRD countries)SudanSurinameSwazilandSwedenSwitzerlandSyrian Arab RepublicTajikistanTanzaniaThailandTimor-LesteTogoTongaTrinidad and TobagoTunisiaTurkeyTurkmenistanTurks and Caicos IslandsUgandaUkraineUnited Arab EmiratesUnited KingdomUnited StatesUpper middle incomeUruguayUzbekistanVanuatuVenezuela, RBVietnamWest Bank and GazaWorldYemen, Rep.ZambiaZimbabwe Linha do tempo:
Nesta escala de tempo está apresentado um gráfico de 1961 ano até 2014 ano Fiji. Dados de 1960 ano ausente. O número de observações reais por data: 54.
Fonte (nome):
Indicadores de desenvolvimento mundial
Fonte (organização):
Carbon Dioxide Information Analysis Center, Environmental Sciences Division, Oak Ridge National Laboratory, Tennessee, United States.
Categorias:
Climate Change, Environment
Foi atualizado:
23 abr 2017 ano
Indicadores de alterações dos valores ao longo dos anos
Mínimo:
168.682
1 jan 1962 ano
Máximo:
1.709 mil
1 jan 2014 ano
Na data de observação
Valor
Mudança absoluta
A alteração em relação ao valor anterior
1 jan 1961 ano
194.351
+194.351
0.0%
1 jan 1962 ano
168.682
-25.669
-13.21%
1 jan 1963 ano
231.021
+62.339
36.96%
1 jan 1964 ano
242.022
+11.001
4.76%
1 jan 1965 ano
425.372
+183.35
75.76%
1 jan 1966 ano
344.698
-80.674
-18.97%
1 jan 1967 ano
322.696
-22.002
-6.38%
1 jan 1968 ano
355.699
+33.003
10.23%
1 jan 1969 ano
396.036
+40.337
11.34%
1 jan 1970 ano
432.706
+36.67
9.26%
1 jan 1971 ano
520.714
+88.008
20.34%
1 jan 1972 ano
550.05
+29.336
5.63%
1 jan 1973 ano
579.386
+29.336
5.33%
1 jan 1974 ano
630.724
+51.338
8.86%
1 jan 1975 ano
671.061
+40.337
6.4%
1 jan 1976 ano
623.39
-47.671
-7.1%
1 jan 1977 ano
484.044
-139.346
-22.35%
1 jan 1978 ano
766.403
+282.359
58.33%
1 jan 1979 ano
711.398
-55.005
-7.18%
1 jan 1980 ano
839.743
+128.345
18.04%
1 jan 1981 ano
795.739
-44.004
-5.24%
1 jan 1982 ano
1.082 mil
+286.026
35.94%
1 jan 1983 ano
839.743
-242.022
-22.37%
1 jan 1984 ano
715.065
-124.678
-14.85%
1 jan 1985 ano
583.053
-132.012
-18.46%
1 jan 1986 ano
579.386
-3.667
-0.63%
1 jan 1987 ano
605.055
+25.669
4.43%
1 jan 1988 ano
476.71
-128.345
-21.21%
1 jan 1989 ano
553.717
+77.007
16.15%
1 jan 1990 ano
630.724
+77.007
13.91%
1 jan 1991 ano
817.741
+187.017
29.65%
1 jan 1992 ano
674.728
-143.013
-17.49%
1 jan 1993 ano
722.399
+47.671
7.07%
1 jan 1994 ano
762.736
+40.337
5.58%
1 jan 1995 ano
817.741
+55.005
7.21%
1 jan 1996 ano
869.079
+51.338
6.28%
1 jan 1997 ano
894.748
+25.669
2.95%
1 jan 1998 ano
737.067
-157.681
-17.62%
1 jan 1999 ano
704.064
-33.003
-4.48%
1 jan 2000 ano
803.073
+99.009
14.06%
1 jan 2001 ano
865.412
+62.339
7.76%
1 jan 2002 ano
1.115 mil
+249.356
28.81%
1 jan 2003 ano
836.076
-278.692
-25.0%
1 jan 2004 ano
861.745
+25.669
3.07%
1 jan 2005 ano
1.133 mil
+271.358
31.49%
1 jan 2006 ano
1.364 mil
+231.021
20.39%
1 jan 2007 ano
1.36 mil
-3.667
-0.27%
1 jan 2008 ano
1.203 mil
-157.681
-11.59%
1 jan 2009 ano
502.379
-700.397
-58.23%
1 jan 2010 ano
1.067 mil
+564.718
112.41%
1 jan 2011 ano
1.599 mil
+531.715
49.83%
1 jan 2012 ano
1.591 mil
-7.334
-0.46%
1 jan 2013 ano
1.595 mil
+3.667
0.23%
1 jan 2014 ano
1.709 mil
+113.677
7.13%
Classificação de países por estatísticas atuais por anos


Comentários: