29
/pt/
pt
AIzaSyAYiBZKx7MnpbEhh9jyipgxe19OcubqV5w
April 1, 2024
122972
Dominican Republic
DOM
true
2
1
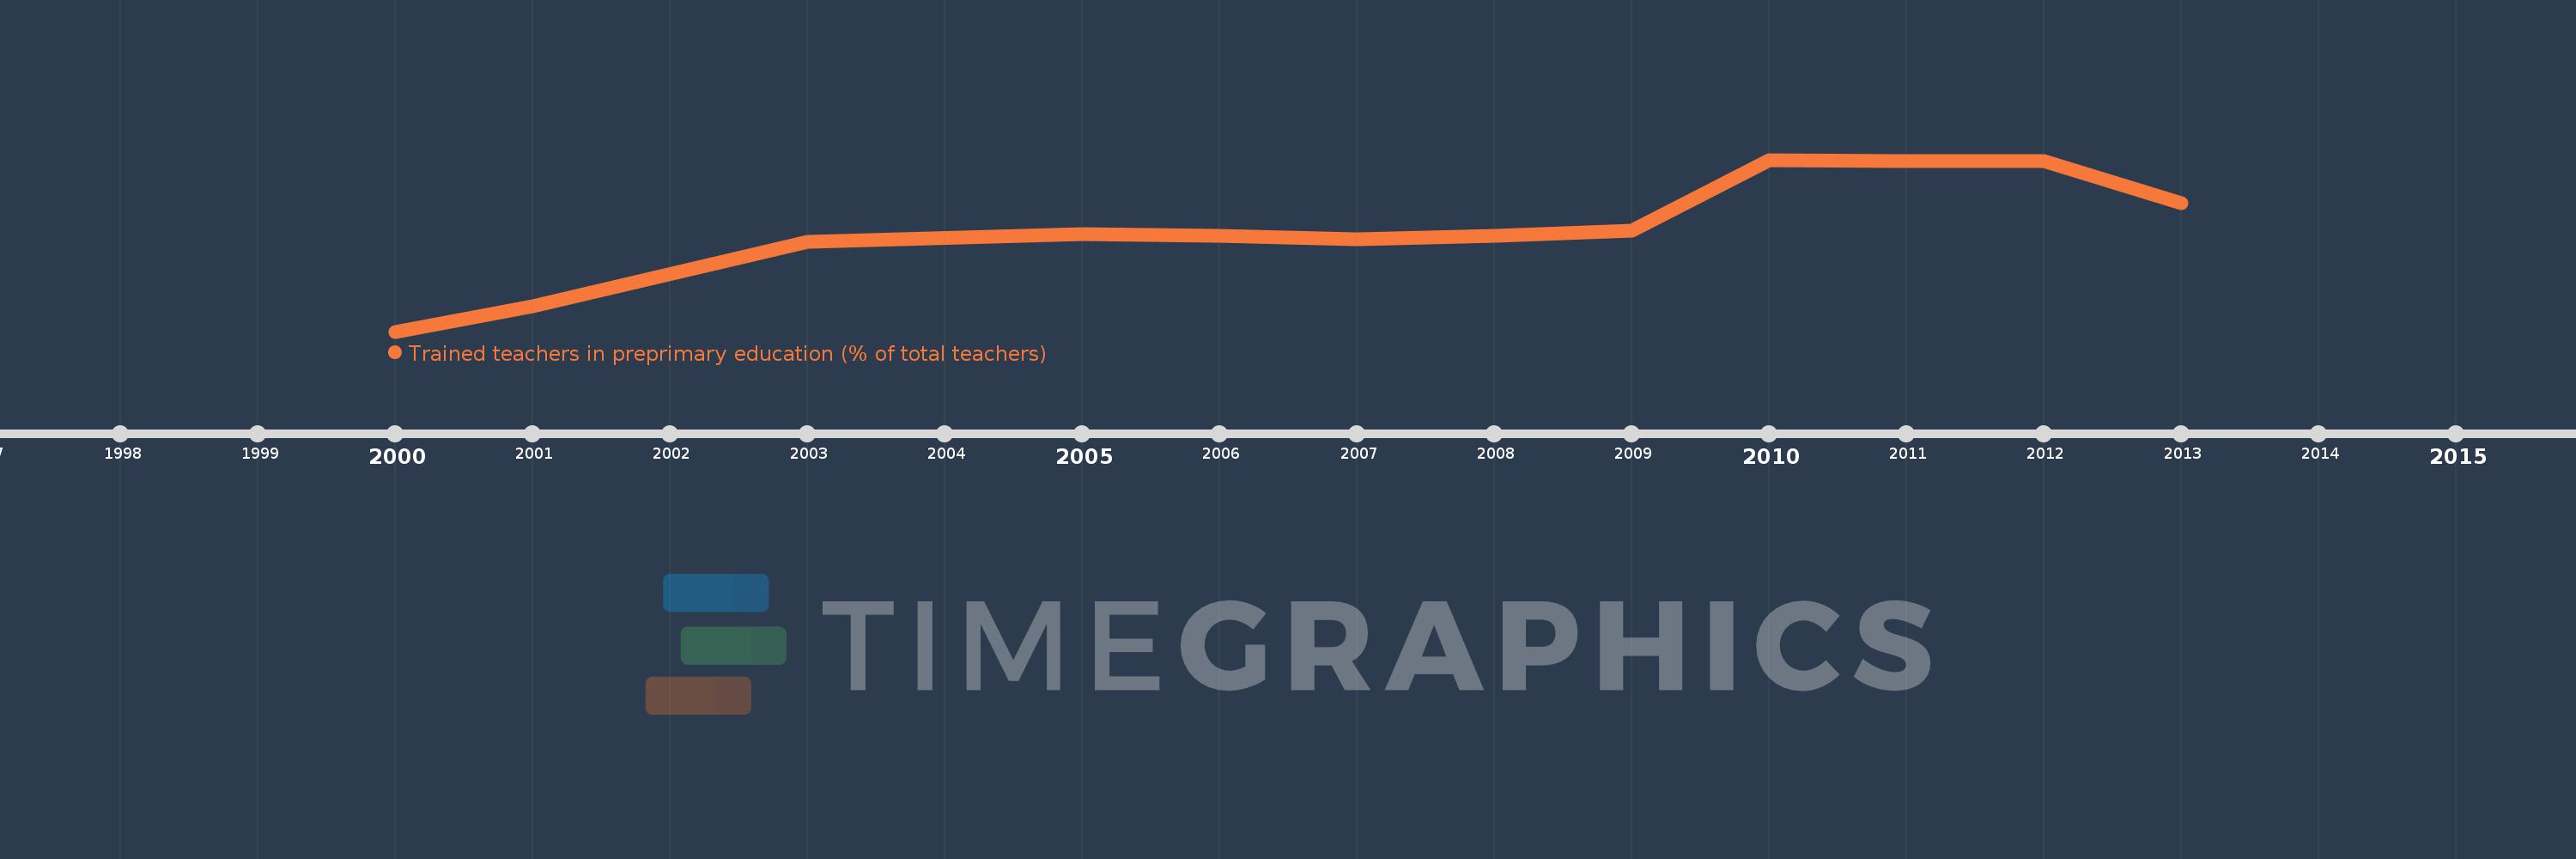
Trained teachers in preprimary education (% of total teachers)
2013,2012,2011,2010,2009,2008,2007,2006,2005,2003,2001,2000
Estas estatísticas em outros países:
Linha do tempo:
Nesta escala de tempo está apresentado um gráfico de 2000 ano até 2013 ano Dominican Republic. Dados de 1999 ano ausente. O número de observações reais por data: 12.
Fonte (nome):
Indicadores de desenvolvimento mundial
Fonte (organização):
United Nations Educational, Scientific, and Cultural Organization (UNESCO) Institute for Statistics.
Categorias:
Education
Foi atualizado:
23 abr 2017 ano
Indicadores de alterações dos valores ao longo dos anos
Mínimo:
53.652
1 jan 2000 ano
Máximo:
95.556
1 jan 2010 ano
Na data de observação
Valor
Mudança absoluta
A alteração em relação ao valor anterior
1 jan 2000 ano
53.652
+53.652
0.0%
1 jan 2001 ano
59.774
+6.122
11.41%
1 jan 2003 ano
75.456
+15.682
26.24%
1 jan 2005 ano
77.385
+1.929
2.56%
1 jan 2006 ano
77.095
-0.289
-0.37%
1 jan 2007 ano
76.075
-1.021
-1.32%
1 jan 2008 ano
77.091
+1.017
1.34%
1 jan 2009 ano
78.33
+1.238
1.61%
1 jan 2010 ano
95.556
+17.226
21.99%
1 jan 2011 ano
95.205
-0.351
-0.37%
1 jan 2012 ano
95.321
+0.116
0.12%
1 jan 2013 ano
85.032
-10.29
-10.79%
Classificação de países por estatísticas atuais por anos


Comentários: