29
/pt/
pt
AIzaSyAYiBZKx7MnpbEhh9jyipgxe19OcubqV5w
April 1, 2024
120798
Dominica
DMA
true
2
1
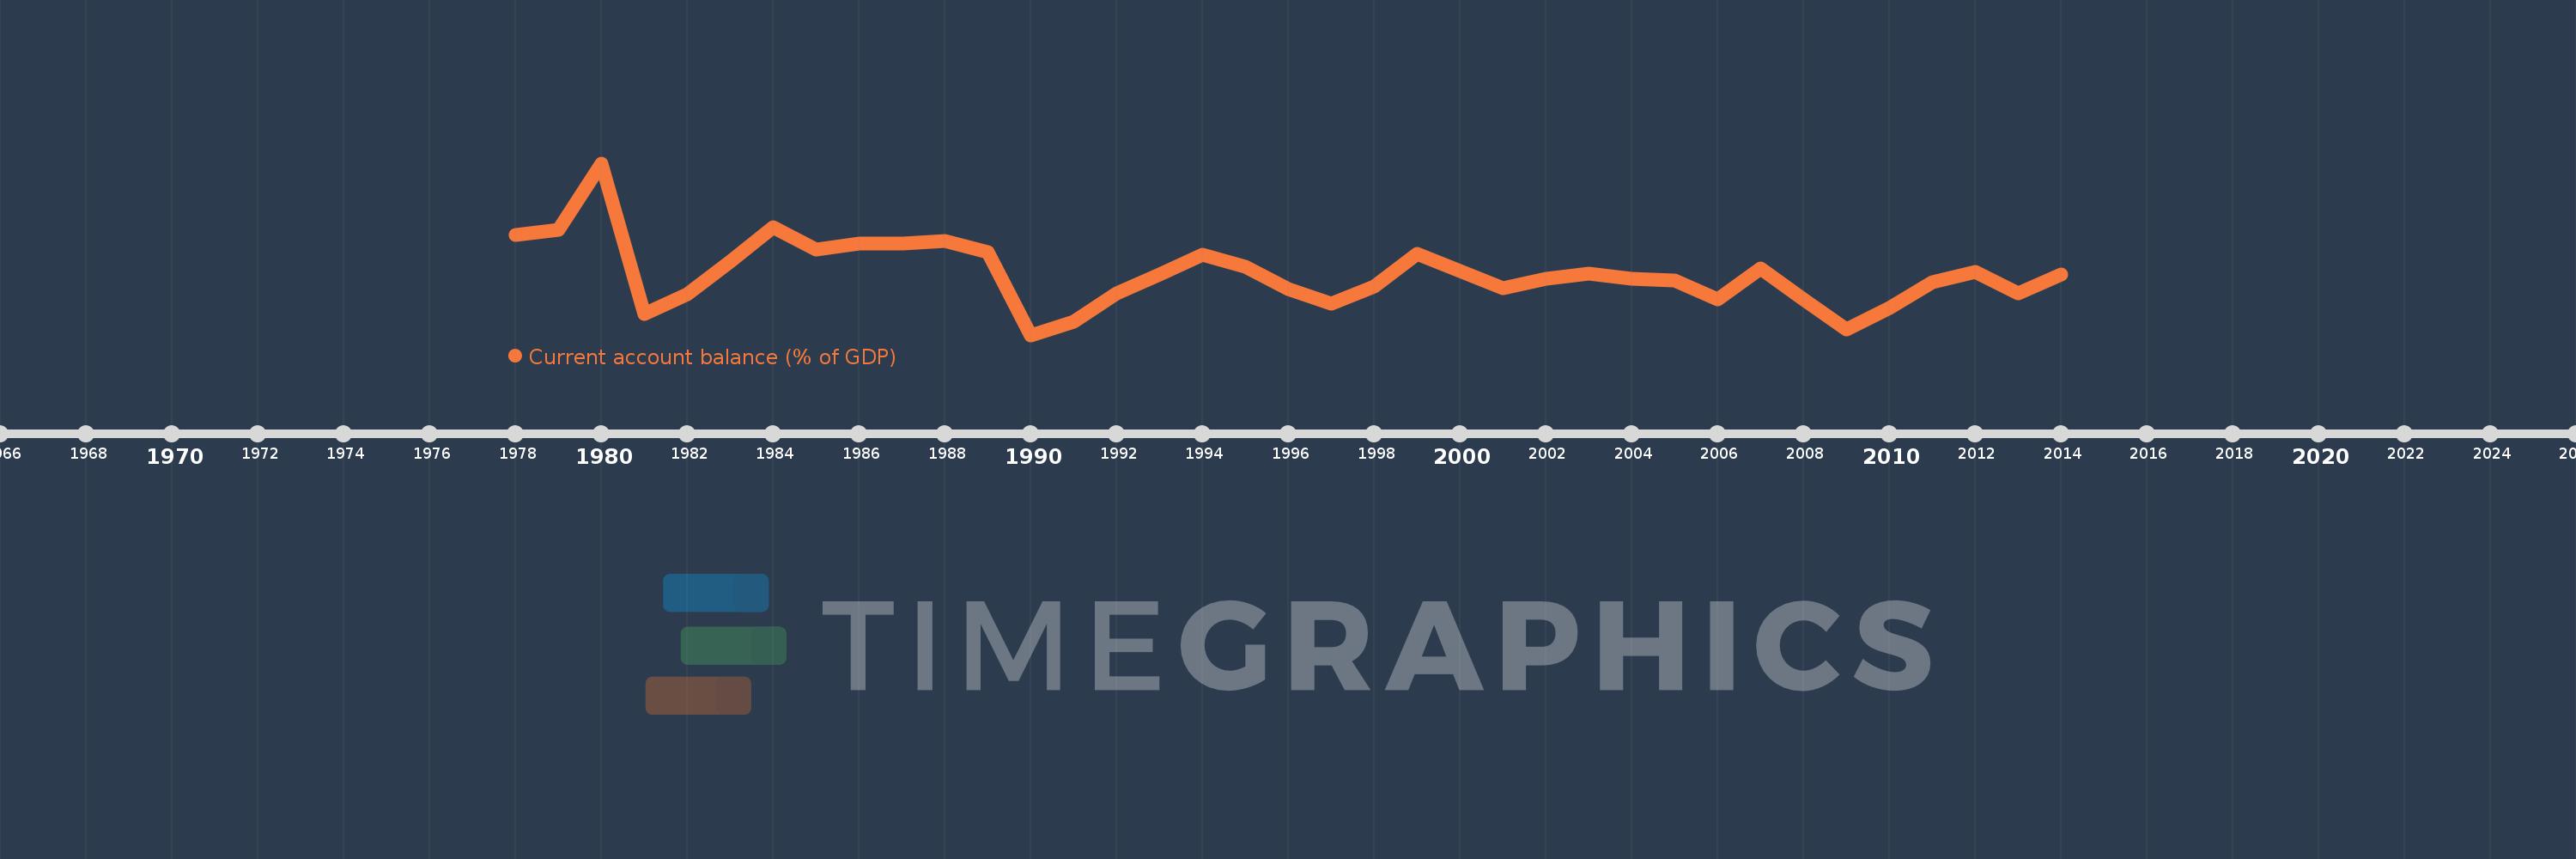
Current account balance (% of GDP)
2014,2013,2012,2011,2010,2009,2008,2007,2006,2005,2004,2003,2002,2001,2000,1999,1998,1997,1996,1995,1994,1993,1992,1991,1990,1989,1988,1987,1986,1985,1984,1983,1982,1981,1980,1979,1978
Estas estatísticas em outros países:
AfghanistanAlbaniaAlgeriaAngolaAntigua and BarbudaArgentinaArmeniaArubaAustraliaAustriaAzerbaijanBahamas, TheBahrainBangladeshBarbadosBelarusBelgiumBelizeBeninBermudaBhutanBoliviaBosnia and HerzegovinaBotswanaBrazilBrunei DarussalamBulgariaBurkina FasoBurundiCabo VerdeCambodiaCameroonCanadaCentral African RepublicChadChileChinaColombiaComorosCongo, Dem. Rep.Congo, Rep.Costa RicaCote d'IvoireCroatiaCyprusCzech RepublicDenmarkDjiboutiDominicaDominican RepublicEcuadorEgypt, Arab Rep.El SalvadorEquatorial GuineaEritreaEstoniaEthiopiaFaroe IslandsFijiFinlandFranceGabonGambia, TheGeorgiaGermanyGhanaGreeceGrenadaGuatemalaGuineaGuinea-BissauGuyanaHaitiHondurasHong Kong SAR, ChinaHungaryIcelandIndiaIndonesiaIran, Islamic Rep.IraqIrelandIsraelItalyJamaicaJapanJordanKazakhstanKenyaKiribatiKorea, Rep.KosovoKuwaitKyrgyz RepublicLao PDRLatviaLebanonLesothoLiberiaLibyaLithuaniaLuxembourgMacao SAR, ChinaMacedonia, FYRMadagascarMalawiMalaysiaMaldivesMaliMaltaMarshall IslandsMauritaniaMauritiusMexicoMicronesia, Fed. Sts.MoldovaMongoliaMontenegroMoroccoMozambiqueMyanmarNamibiaNepalNetherlandsNew ZealandNicaraguaNigerNigeriaNorwayOmanPakistanPalauPanamaPapua New GuineaParaguayPeruPhilippinesPolandPortugalQatarRomaniaRussian FederationRwandaSamoaSao Tome and PrincipeSaudi ArabiaSenegalSerbiaSeychellesSierra LeoneSingaporeSlovak RepublicSloveniaSolomon IslandsSouth AfricaSouth SudanSpainSri LankaSt. Kitts and NevisSt. LuciaSt. Vincent and the GrenadinesSudanSurinameSwazilandSwedenSwitzerlandSyrian Arab RepublicTajikistanTanzaniaThailandTimor-LesteTogoTongaTrinidad and TobagoTunisiaTurkeyTuvaluUgandaUkraineUnited KingdomUnited StatesUruguayVanuatuVenezuela, RBVietnamWest Bank and GazaYemen, Rep.ZambiaZimbabwe Linha do tempo:
Nesta escala de tempo está apresentado um gráfico de 1978 ano até 2014 ano Dominica. Dados de 1977 ano ausente. O número de observações reais por data: 37.
Fonte (nome):
Indicadores de desenvolvimento mundial
Fonte (organização):
International Monetary Fund, Balance of Payments Statistics Yearbook and data files, and World Bank and OECD GDP estimates.
Categorias:
Economy & Growth
Foi atualizado:
23 abr 2017 ano
Indicadores de alterações dos valores ao longo dos anos
Mínimo:
-29.673
1 jan 1990 ano
Máximo:
14.222
1 jan 1980 ano
Na data de observação
Valor
Mudança absoluta
A alteração em relação ao valor anterior
1 jan 1978 ano
-4.124
-4.124
0.0%
1 jan 1979 ano
-2.878
+1.246
-30.22%
1 jan 1980 ano
14.222
+17.1
-594.18%
1 jan 1981 ano
-24.196
-38.419
-270.13%
1 jan 1982 ano
-19.334
+4.863
-20.1%
1 jan 1983 ano
-10.833
+8.5
-43.97%
1 jan 1984 ano
-2.19
+8.643
-79.78%
1 jan 1985 ano
-7.904
-5.714
260.94%
1 jan 1986 ano
-6.392
+1.513
-19.14%
1 jan 1987 ano
-6.269
+0.123
-1.92%
1 jan 1988 ano
-5.55
+0.719
-11.48%
1 jan 1989 ano
-8.508
-2.958
53.3%
1 jan 1990 ano
-29.673
-21.165
248.78%
1 jan 1991 ano
-26.171
+3.503
-11.8%
1 jan 1992 ano
-18.946
+7.225
-27.61%
1 jan 1993 ano
-14.144
+4.802
-25.35%
1 jan 1994 ano
-9.079
+5.065
-35.81%
1 jan 1995 ano
-12.139
-3.06
33.71%
1 jan 1996 ano
-17.962
-5.822
47.96%
1 jan 1997 ano
-21.638
-3.677
20.47%
1 jan 1998 ano
-17.191
+4.448
-20.55%
1 jan 1999 ano
-8.924
+8.267
-48.09%
1 jan 2000 ano
-13.361
-4.438
49.73%
1 jan 2001 ano
-17.811
-4.45
33.3%
1 jan 2002 ano
-15.195
+2.616
-14.69%
1 jan 2003 ano
-14.023
+1.172
-7.72%
1 jan 2004 ano
-15.189
-1.166
8.32%
1 jan 2005 ano
-15.705
-0.515
3.39%
1 jan 2006 ano
-20.542
-4.837
30.8%
1 jan 2007 ano
-12.77
+7.772
-37.83%
1 jan 2008 ano
-20.635
-7.864
61.58%
1 jan 2009 ano
-28.347
-7.713
37.38%
1 jan 2010 ano
-22.712
+5.635
-19.88%
1 jan 2011 ano
-16.237
+6.475
-28.51%
1 jan 2012 ano
-13.555
+2.683
-16.52%
1 jan 2013 ano
-18.955
-5.401
39.85%
1 jan 2014 ano
-14.19
+4.765
-25.14%
Classificação de países por estatísticas atuais por anos


Comentários: