29
/pt/
pt
AIzaSyAYiBZKx7MnpbEhh9jyipgxe19OcubqV5w
April 1, 2024
119786
Djibouti
DJI
true
2
1
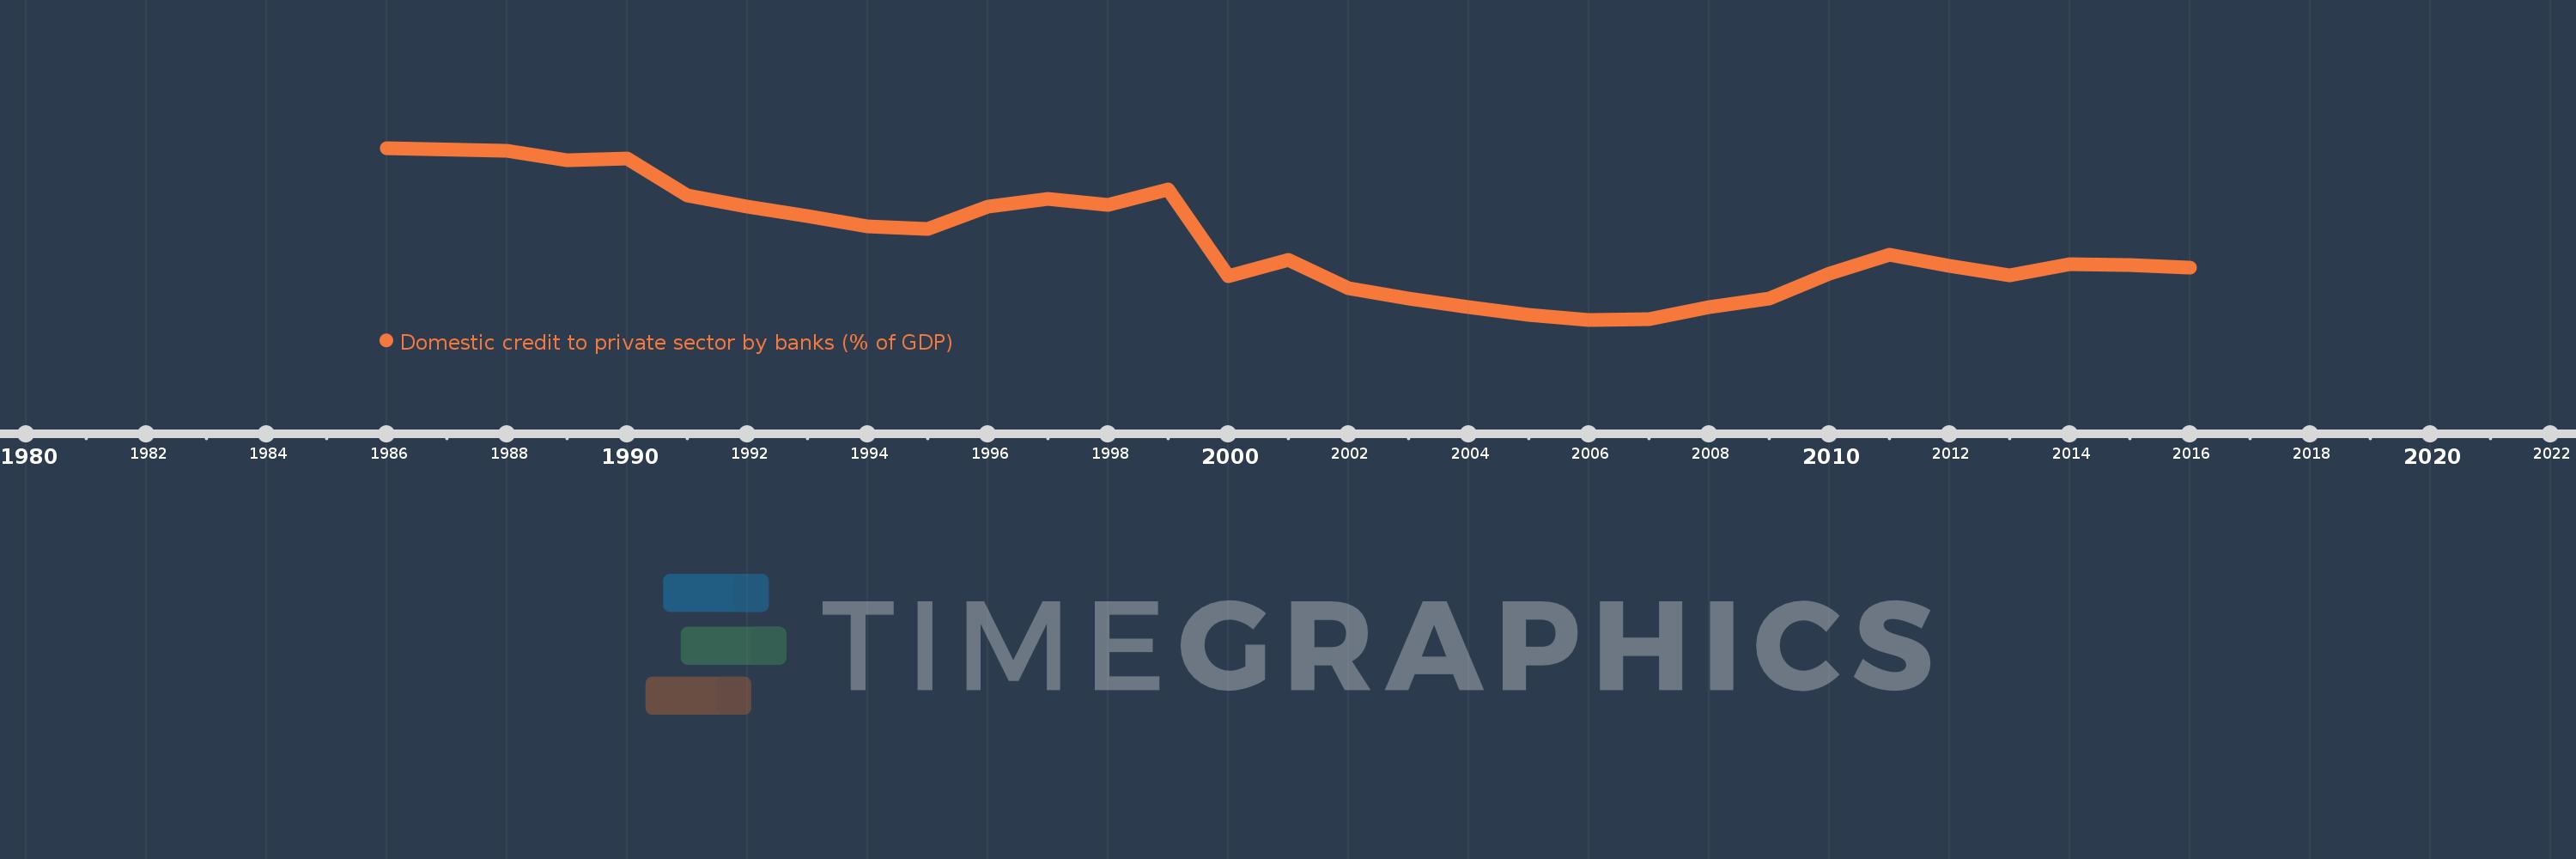
Domestic credit to private sector by banks (% of GDP)
2016,2015,2014,2013,2012,2011,2010,2009,2008,2007,2006,2005,2004,2003,2002,2001,2000,1999,1998,1997,1996,1995,1994,1993,1992,1991,1990,1989,1988,1986
Estas estatísticas em outros países:
AfghanistanAlbaniaAlgeriaAngolaAntigua and BarbudaArab WorldArgentinaArmeniaArubaAustraliaAustriaAzerbaijanBahamas, TheBahrainBangladeshBarbadosBelarusBelgiumBelizeBeninBhutanBoliviaBosnia and HerzegovinaBotswanaBrazilBrunei DarussalamBulgariaBurkina FasoBurundiCabo VerdeCambodiaCameroonCanadaCaribbean small statesCentral African RepublicCentral Europe and the BalticsChadChileChinaColombiaComorosCongo, Dem. Rep.Congo, Rep.Costa RicaCote d'IvoireCroatiaCyprusCzech RepublicDenmarkDjiboutiDominicaDominican RepublicEarly-demographic dividendEast Asia & PacificEast Asia & Pacific (excluding high income)East Asia & Pacific (IDA & IBRD countries)EcuadorEgypt, Arab Rep.El SalvadorEquatorial GuineaEritreaEstoniaEthiopiaEuro areaEurope & Central AsiaEurope & Central Asia (excluding high income)Europe & Central Asia (IDA & IBRD countries)European UnionFijiFinlandFragile and conflict affected situationsFranceGabonGambia, TheGeorgiaGermanyGhanaGreeceGrenadaGuatemalaGuineaGuinea-BissauGuyanaHaitiHeavily indebted poor countries (HIPC)High incomeHondurasHong Kong SAR, ChinaHungaryIBRD onlyIcelandIDA & IBRD totalIDA blendIDA onlyIDA totalIndiaIndonesiaIran, Islamic Rep.IraqIrelandIsraelItalyJamaicaJapanJordanKazakhstanKenyaKorea, Rep.KosovoKuwaitKyrgyz RepublicLao PDRLate-demographic dividendLatin America & Caribbean Latin America & Caribbean (excluding high income)Latin America & the Caribbean (IDA & IBRD countries)LatviaLeast developed countries: UN classificationLebanonLesothoLiberiaLibyaLithuaniaLow & middle incomeLow incomeLower middle incomeLuxembourgMacao SAR, ChinaMacedonia, FYRMadagascarMalawiMalaysiaMaldivesMaliMaltaMauritaniaMauritiusMexicoMicronesia, Fed. Sts.Middle East & North AfricaMiddle East & North Africa (excluding high income)Middle East & North Africa (IDA & IBRD countries)Middle incomeMoldovaMongoliaMontenegroMoroccoMozambiqueMyanmarNamibiaNepalNetherlandsNew ZealandNicaraguaNigerNigeriaNorth AmericaNorwayOECD membersOmanOther small statesPacific island small statesPakistanPanamaPapua New GuineaParaguayPeruPhilippinesPolandPortugalPost-demographic dividendPre-demographic dividendQatarRomaniaRussian FederationRwandaSamoaSao Tome and PrincipeSaudi ArabiaSenegalSerbiaSeychellesSierra LeoneSingaporeSlovak RepublicSloveniaSmall statesSolomon IslandsSouth AfricaSouth AsiaSouth Asia (IDA & IBRD)South SudanSpainSri LankaSt. Kitts and NevisSt. LuciaSt. Vincent and the GrenadinesSub-Saharan Africa Sub-Saharan Africa (excluding high income)Sub-Saharan Africa (IDA & IBRD countries)SudanSurinameSwazilandSwedenSwitzerlandSyrian Arab RepublicTajikistanTanzaniaThailandTimor-LesteTogoTongaTrinidad and TobagoTunisiaTurkeyUgandaUkraineUnited Arab EmiratesUnited KingdomUnited StatesUpper middle incomeUruguayVanuatuVenezuela, RBVietnamWest Bank and GazaWorldYemen, Rep.ZambiaZimbabwe Linha do tempo:
Nesta escala de tempo está apresentado um gráfico de 1986 ano até 2016 ano Djibouti. Dados de 1985 ano ausente. O número de observações reais por data: 30.
Fonte (nome):
Indicadores de desenvolvimento mundial
Fonte (organização):
International Monetary Fund, International Financial Statistics and data files, and World Bank and OECD GDP estimates.
Categorias:
Financial Sector
Foi atualizado:
23 abr 2017 ano
Indicadores de alterações dos valores ao longo dos anos
Mínimo:
20.075
1 jan 2006 ano
Máximo:
54.397
1 jan 1986 ano
Na data de observação
Valor
Mudança absoluta
A alteração em relação ao valor anterior
1 jan 1986 ano
54.397
+54.397
0.0%
1 jan 1988 ano
53.777
-0.62
-1.14%
1 jan 1989 ano
51.931
-1.845
-3.43%
1 jan 1990 ano
52.335
+0.404
0.78%
1 jan 1991 ano
44.988
-7.347
-14.04%
1 jan 1992 ano
42.716
-2.272
-5.05%
1 jan 1993 ano
40.856
-1.86
-4.35%
1 jan 1994 ano
38.704
-2.153
-5.27%
1 jan 1995 ano
38.202
-0.502
-1.3%
1 jan 1996 ano
42.714
+4.512
11.81%
1 jan 1997 ano
44.223
+1.51
3.53%
1 jan 1998 ano
43.061
-1.162
-2.63%
1 jan 1999 ano
46.061
+3.0
6.97%
1 jan 2000 ano
28.855
-17.206
-37.35%
1 jan 2001 ano
32.065
+3.21
11.13%
1 jan 2002 ano
26.44
-5.625
-17.54%
1 jan 2003 ano
24.396
-2.045
-7.73%
1 jan 2004 ano
22.584
-1.812
-7.43%
1 jan 2005 ano
21.112
-1.473
-6.52%
1 jan 2006 ano
20.075
-1.037
-4.91%
1 jan 2007 ano
20.183
+0.108
0.54%
1 jan 2008 ano
22.522
+2.339
11.59%
1 jan 2009 ano
24.336
+1.814
8.05%
1 jan 2010 ano
29.347
+5.012
20.59%
1 jan 2011 ano
33.11
+3.763
12.82%
1 jan 2012 ano
30.909
-2.201
-6.65%
1 jan 2013 ano
28.931
-1.978
-6.4%
1 jan 2014 ano
31.118
+2.187
7.56%
1 jan 2015 ano
30.956
-0.162
-0.52%
1 jan 2016 ano
30.467
-0.489
-1.58%
Classificação de países por estatísticas atuais por anos


Comentários: