29
/pt/
pt
AIzaSyAYiBZKx7MnpbEhh9jyipgxe19OcubqV5w
April 1, 2024
118278
Czech Republic
CZE
true
2
1
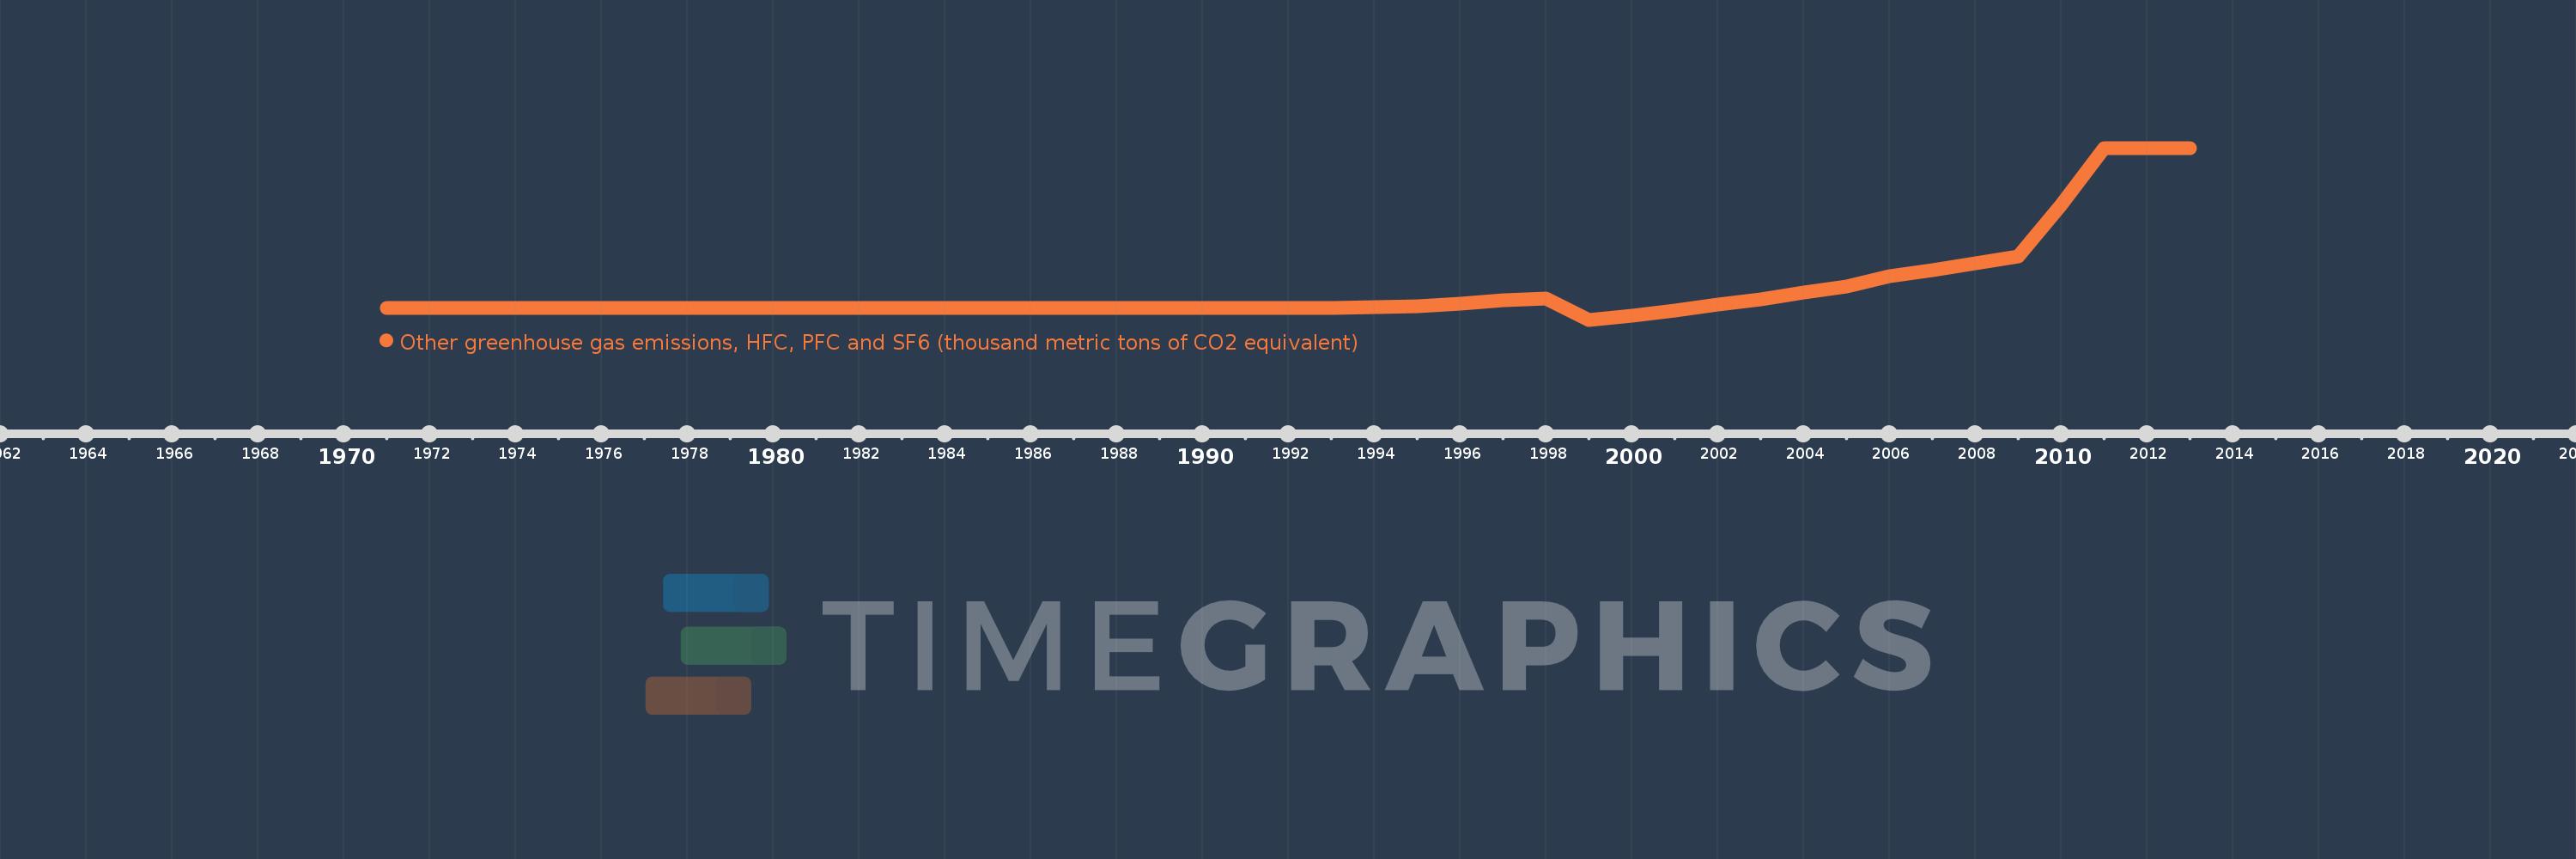
Other greenhouse gas emissions, HFC, PFC and SF6 (thousand metric tons of CO2 equivalent)
2013,2012,2011,2010,2009,2008,2007,2006,2005,2004,2003,2002,2001,2000,1999,1998,1997,1996,1995,1994,1993,1992,1991,1990,1989,1988,1987,1986,1985,1984,1983,1982,1981,1980,1979,1978,1977,1976,1975,1974,1973,1972,1971
Estas estatísticas em outros países:
AfghanistanAlbaniaAlgeriaAmerican SamoaAngolaAntigua and BarbudaArab WorldArgentinaArmeniaArubaAustraliaAustriaAzerbaijanBahamas, TheBahrainBangladeshBarbadosBelarusBelgiumBelizeBeninBermudaBhutanBoliviaBosnia and HerzegovinaBotswanaBrazilBritish Virgin IslandsBrunei DarussalamBulgariaBurkina FasoBurundiCabo VerdeCambodiaCameroonCanadaCaribbean small statesCayman IslandsCentral African RepublicCentral Europe and the BalticsChadChileChinaColombiaComorosCongo, Dem. Rep.Congo, Rep.Costa RicaCote d'IvoireCroatiaCubaCyprusCzech RepublicDenmarkDjiboutiDominicaDominican RepublicEarly-demographic dividendEast Asia & PacificEast Asia & Pacific (excluding high income)East Asia & Pacific (IDA & IBRD countries)EcuadorEgypt, Arab Rep.El SalvadorEquatorial GuineaEritreaEstoniaEthiopiaEuro areaEurope & Central AsiaEurope & Central Asia (excluding high income)Europe & Central Asia (IDA & IBRD countries)European UnionFaroe IslandsFijiFinlandFragile and conflict affected situationsFranceFrench PolynesiaGabonGambia, TheGeorgiaGermanyGhanaGibraltarGreeceGreenlandGrenadaGuamGuatemalaGuineaGuinea-BissauGuyanaHaitiHeavily indebted poor countries (HIPC)High incomeHondurasHong Kong SAR, ChinaHungaryIBRD onlyIcelandIDA & IBRD totalIDA blendIDA onlyIDA totalIndiaIndonesiaIran, Islamic Rep.IraqIrelandIsraelItalyJamaicaJapanJordanKazakhstanKenyaKiribatiKorea, Dem. People’s Rep.Korea, Rep.KuwaitKyrgyz RepublicLao PDRLate-demographic dividendLatin America & Caribbean Latin America & Caribbean (excluding high income)Latin America & the Caribbean (IDA & IBRD countries)LatviaLeast developed countries: UN classificationLebanonLesothoLiberiaLibyaLithuaniaLow & middle incomeLow incomeLower middle incomeLuxembourgMacao SAR, ChinaMacedonia, FYRMadagascarMalawiMalaysiaMaldivesMaliMaltaMauritaniaMauritiusMexicoMiddle East & North AfricaMiddle East & North Africa (excluding high income)Middle East & North Africa (IDA & IBRD countries)Middle incomeMoldovaMongoliaMoroccoMozambiqueMyanmarNamibiaNauruNepalNetherlandsNew CaledoniaNew ZealandNicaraguaNigerNigeriaNorth AmericaNorwayOECD membersOmanOther small statesPacific island small statesPakistanPanamaPapua New GuineaParaguayPeruPhilippinesPolandPortugalPost-demographic dividendPre-demographic dividendPuerto RicoQatarRomaniaRussian FederationRwandaSamoaSao Tome and PrincipeSaudi ArabiaSenegalSeychellesSierra LeoneSingaporeSlovak RepublicSloveniaSmall statesSolomon IslandsSomaliaSouth AfricaSouth AsiaSouth Asia (IDA & IBRD)SpainSri LankaSt. Kitts and NevisSt. LuciaSt. Vincent and the GrenadinesSub-Saharan Africa Sub-Saharan Africa (excluding high income)Sub-Saharan Africa (IDA & IBRD countries)SudanSurinameSwazilandSwedenSwitzerlandSyrian Arab RepublicTajikistanTanzaniaThailandTimor-LesteTogoTongaTrinidad and TobagoTunisiaTurkeyTurkmenistanTurks and Caicos IslandsTuvaluUgandaUkraineUnited Arab EmiratesUnited KingdomUnited StatesUpper middle incomeUruguayUzbekistanVanuatuVenezuela, RBVietnamVirgin Islands (U.S.)WorldYemen, Rep.ZambiaZimbabwe Linha do tempo:
Nesta escala de tempo está apresentado um gráfico de 1971 ano até 2013 ano Czech Republic. Dados de 1970 ano ausente. O número de observações reais por data: 43.
Fonte (nome):
Indicadores de desenvolvimento mundial
Fonte (organização):
World Bank staff estimates from original source: European Commission, Joint Research Centre (JRC)/Netherlands Environmental Assessment Agency (PBL). Emission Database for Global Atmospheric Research (EDGAR): http://edgar.jrc.ec.europa.eu/.
Categorias:
Climate Change, Environment
Foi atualizado:
23 abr 2017 ano
Indicadores de alterações dos valores ao longo dos anos
Mínimo:
261.13
1 jan 1999 ano
Máximo:
3.655 mil
1 jan 2013 ano
Na data de observação
Valor
Mudança absoluta
A alteração em relação ao valor anterior
1 jan 1971 ano
486.17
+486.17
0.0%
1 jan 1972 ano
486.241
+0.07
0.01%
1 jan 1973 ano
486.301
+0.061
0.01%
1 jan 1974 ano
486.371
+0.07
0.01%
1 jan 1975 ano
486.442
+0.07
0.01%
1 jan 1976 ano
486.502
+0.06
0.01%
1 jan 1977 ano
486.573
+0.071
0.01%
1 jan 1978 ano
486.643
+0.07
0.01%
1 jan 1979 ano
486.714
+0.071
0.01%
1 jan 1980 ano
486.794
+0.08
0.02%
1 jan 1981 ano
489.15
+2.356
0.48%
1 jan 1982 ano
489.21
+0.06
0.01%
1 jan 1983 ano
489.29
+0.08
0.02%
1 jan 1984 ano
489.35
+0.06
0.01%
1 jan 1985 ano
489.41
+0.06
0.01%
1 jan 1986 ano
489.48
+0.07
0.01%
1 jan 1987 ano
489.6
+0.12
0.02%
1 jan 1988 ano
489.71
+0.11
0.02%
1 jan 1989 ano
489.83
+0.12
0.02%
1 jan 1990 ano
489.94
+0.11
0.02%
1 jan 1991 ano
490.149
+0.209
0.04%
1 jan 1992 ano
490.881
+0.732
0.15%
1 jan 1993 ano
493.14
+2.259
0.46%
1 jan 1994 ano
503.7
+10.56
2.14%
1 jan 1995 ano
525.08
+21.38
4.24%
1 jan 1996 ano
575.1
+50.02
9.53%
1 jan 1997 ano
640.17
+65.07
11.31%
1 jan 1998 ano
685.85
+45.68
7.14%
1 jan 1999 ano
261.13
-424.72
-61.93%
1 jan 2000 ano
345.4
+84.27
32.27%
1 jan 2001 ano
441.8
+96.4
27.91%
1 jan 2002 ano
556.457
+114.657
25.95%
1 jan 2003 ano
658.811
+102.354
18.39%
1 jan 2004 ano
798.009
+139.199
21.13%
1 jan 2005 ano
925.881
+127.872
16.02%
1 jan 2006 ano
1.123 mil
+197.209
21.3%
1 jan 2007 ano
1.237 mil
+113.6
10.11%
1 jan 2008 ano
1.372 mil
+135.742
10.98%
1 jan 2009 ano
1.508 mil
+135.528
9.88%
1 jan 2010 ano
2.533 mil
+1.025 mil
67.98%
1 jan 2011 ano
3.655 mil
+1.122 mil
44.29%
1 jan 2012 ano
3.655 mil
0.0
0.0%
1 jan 2013 ano
3.655 mil
+0.0
0.0%
Classificação de países por estatísticas atuais por anos


Comentários: