30
/pt/
AIzaSyAYiBZKx7MnpbEhh9jyipgxe19OcubqV5w
April 1, 2024
116195
Cuba
CUB
true
2
1
Pupil-teacher ratio, lower secondary
2015,2014,2013,2012,2011,2010,2009,2008,2007,2006,2005,2004,2003,2002,2001,2000,1998,1997
Download
Biblioteca de estatísticas globais →Cuba →

Pupil-teacher ratio, lower secondary

Estas estatísticas em outros países:

AfghanistanAlbaniaAlgeriaAndorraAngolaAntigua and BarbudaArab WorldArgentinaAustriaBahamas, TheBahrainBangladeshBelarusBelgiumBelizeBeninBermudaBhutanBoliviaBosnia and HerzegovinaBrazilBritish Virgin IslandsBrunei DarussalamBulgariaBurkina FasoBurundiCabo VerdeCambodiaCameroonCanadaCaribbean small statesCayman IslandsCentral Europe and the BalticsChadChileChinaColombiaComorosCongo, Rep.Costa RicaCote d'IvoireCroatiaCubaCyprusCzech RepublicDenmarkDjiboutiDominicaDominican RepublicEarly-demographic dividendEast Asia & PacificEast Asia & Pacific (excluding high income)East Asia & Pacific (IDA & IBRD countries)EcuadorEgypt, Arab Rep.El SalvadorEquatorial GuineaEritreaEstoniaEthiopiaEuro areaEurope & Central AsiaEurope & Central Asia (excluding high income)Europe & Central Asia (IDA & IBRD countries)European UnionFijiFinlandFragile and conflict affected situationsFranceGambia, TheGeorgiaGermanyGhanaGibraltarGreeceGrenadaGuatemalaGuineaGuinea-BissauGuyanaHeavily indebted poor countries (HIPC)High incomeHondurasHong Kong SAR, ChinaHungaryIBRD onlyIDA & IBRD totalIDA blendIDA onlyIDA totalIndiaIndonesiaIran, Islamic Rep.IraqIsraelItalyJamaicaJapanJordanKenyaKiribatiKorea, Rep.KuwaitLao PDRLate-demographic dividendLatin America & Caribbean Latin America & Caribbean (excluding high income)Latin America & the Caribbean (IDA & IBRD countries)LatviaLeast developed countries: UN classificationLebanonLiberiaLiechtensteinLithuaniaLow & middle incomeLow incomeLower middle incomeLuxembourgMacao SAR, ChinaMacedonia, FYRMadagascarMalaysiaMaldivesMaliMaltaMarshall IslandsMauritaniaMexicoMiddle East & North AfricaMiddle East & North Africa (excluding high income)Middle East & North Africa (IDA & IBRD countries)Middle incomeMoldovaMonacoMongoliaMoroccoMozambiqueMyanmarNamibiaNauruNepalNetherlandsNew ZealandNicaraguaNigerNigeriaNorth AmericaNorwayOECD membersOmanOther small statesPacific island small statesPakistanPalauPanamaParaguayPeruPhilippinesPolandPortugalPost-demographic dividendPre-demographic dividendPuerto RicoQatarRomaniaRwandaSamoaSan MarinoSao Tome and PrincipeSaudi ArabiaSenegalSerbiaSeychellesSierra LeoneSingaporeSlovak RepublicSloveniaSmall statesSolomon IslandsSomaliaSouth AsiaSouth Asia (IDA & IBRD)South SudanSpainSri LankaSt. Kitts and NevisSt. LuciaSt. Vincent and the GrenadinesSub-Saharan Africa Sub-Saharan Africa (excluding high income)Sub-Saharan Africa (IDA & IBRD countries)SurinameSwazilandSwedenSwitzerlandSyrian Arab RepublicTajikistanThailandTimor-LesteTogoTongaTrinidad and TobagoTunisiaTurkeyTurks and Caicos IslandsTuvaluUgandaUnited Arab EmiratesUnited KingdomUnited StatesUpper middle incomeUruguayVanuatuVietnamWest Bank and GazaWorldYemen, Rep.Zambia

Linha do tempo:

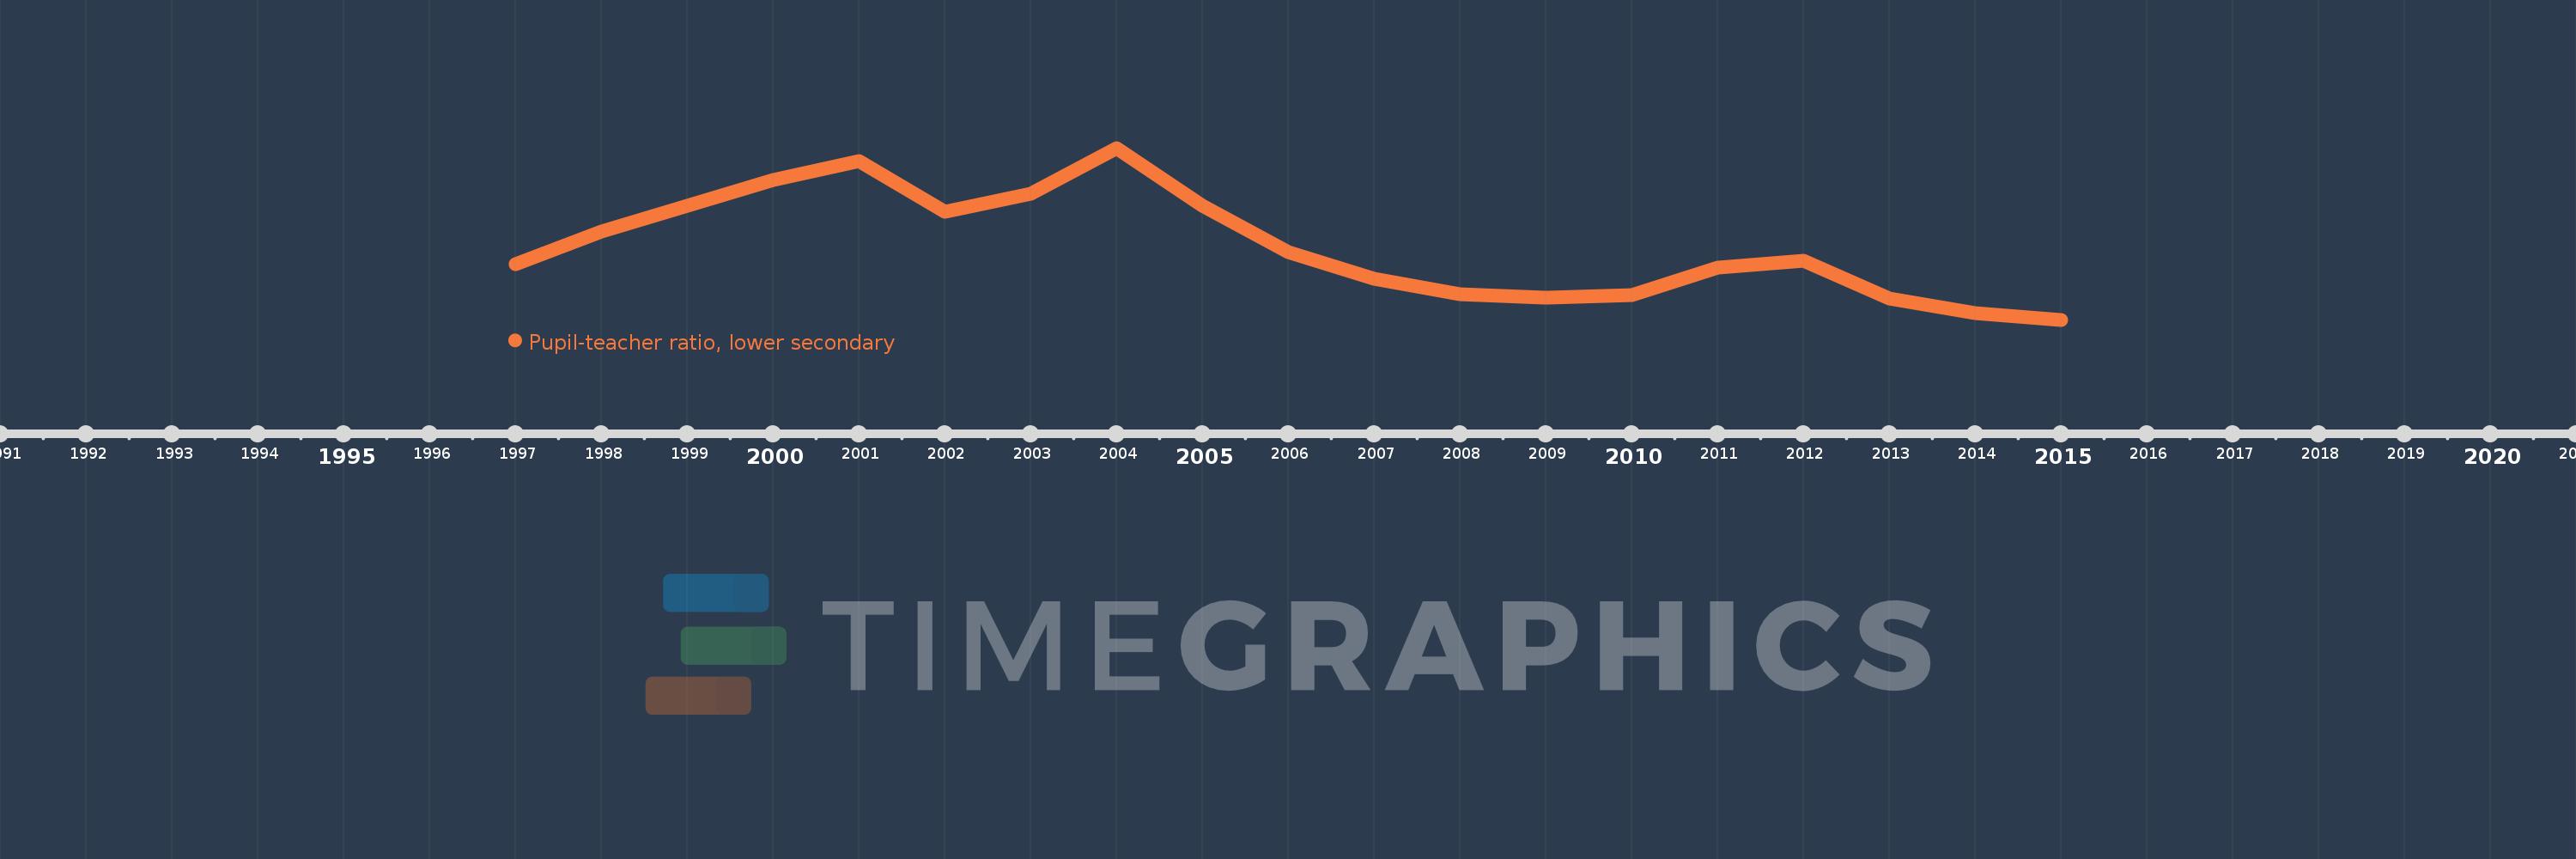
Nesta escala de tempo está apresentado um gráfico de 1997 ano até 2015 ano Cuba. Dados de 1996 ano ausente. O número de observações reais por data: 18.

Fonte (nome):

Indicadores de desenvolvimento mundial

Fonte (organização):

United Nations Educational, Scientific, and Cultural Organization (UNESCO) Institute for Statistics.

Categorias:

Education

Foi atualizado:

23 abr 2017 ano

Indicadores de alterações dos valores ao longo dos anos

Em média:
10.648
Mínimo:
8.886
1 jan 2015 ano
Máximo:
13.141
1 jan 2004 ano
Na data de observação
Valor
Mudança absoluta
A alteração em relação ao valor anterior
1 jan 1997 ano
10.253
+10.253
0.0%
1 jan 1998 ano
11.067
+0.814
7.94%
1 jan 2000 ano
12.342
+1.274
11.52%
1 jan 2001 ano
12.81
+0.468
3.79%
1 jan 2002 ano
11.564
-1.245
-9.72%
1 jan 2003 ano
12.0
+0.436
3.77%
1 jan 2004 ano
13.141
+1.14
9.5%
1 jan 2005 ano
11.701
-1.44
-10.96%
1 jan 2006 ano
10.569
-1.132
-9.68%
1 jan 2007 ano
9.891
-0.678
-6.41%
1 jan 2008 ano
9.528
-0.363
-3.67%
1 jan 2009 ano
9.44
-0.088
-0.92%
1 jan 2010 ano
9.492
+0.052
0.55%
1 jan 2011 ano
10.172
+0.68
7.16%
1 jan 2012 ano
10.357
+0.185
1.81%
1 jan 2013 ano
9.404
-0.953
-9.2%
1 jan 2014 ano
9.052
-0.352
-3.74%
1 jan 2015 ano
8.886
-0.166
-1.83%

Classificação de países por estatísticas atuais por anos