29
/pt/
pt
AIzaSyAYiBZKx7MnpbEhh9jyipgxe19OcubqV5w
April 1, 2024
110847
Congo, Rep.
COG
true
2
1
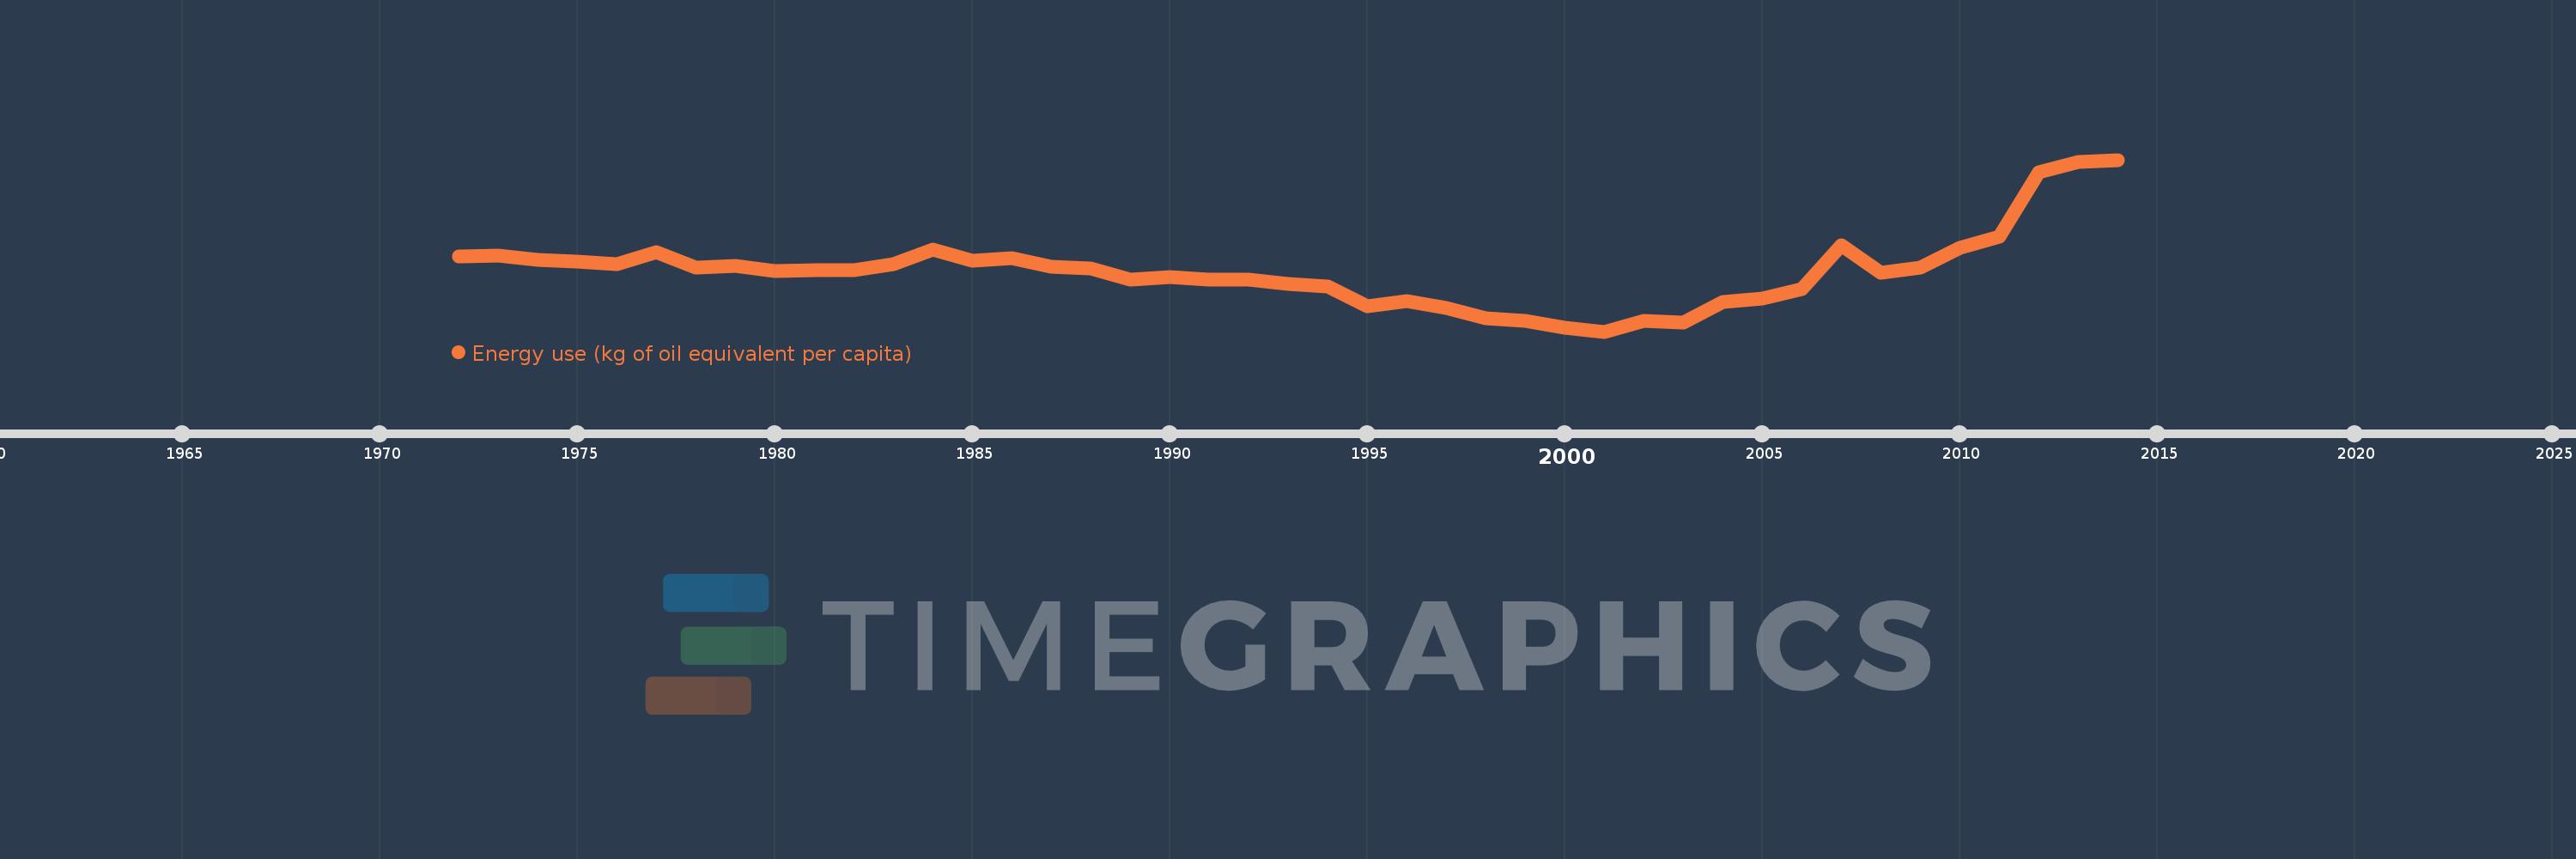
Energy use (kg of oil equivalent per capita)
2014,2013,2012,2011,2010,2009,2008,2007,2006,2005,2004,2003,2002,2001,2000,1999,1998,1997,1996,1995,1994,1993,1992,1991,1990,1989,1988,1987,1986,1985,1984,1983,1982,1981,1980,1979,1978,1977,1976,1975,1974,1973,1972
Estas estatísticas em outros países:
AlbaniaAlgeriaAngolaAntigua and BarbudaArab WorldArgentinaArmeniaAustraliaAustriaAzerbaijanBahamas, TheBahrainBangladeshBarbadosBelarusBelgiumBelizeBeninBhutanBoliviaBosnia and HerzegovinaBotswanaBrazilBrunei DarussalamBulgariaCabo VerdeCambodiaCameroonCanadaCaribbean small statesCentral Europe and the BalticsChileChinaColombiaComorosCongo, Dem. Rep.Congo, Rep.Costa RicaCote d'IvoireCroatiaCubaCuracaoCyprusCzech RepublicDenmarkDjiboutiDominicaDominican RepublicEarly-demographic dividendEast Asia & PacificEast Asia & Pacific (excluding high income)East Asia & Pacific (IDA & IBRD countries)EcuadorEgypt, Arab Rep.El SalvadorEquatorial GuineaEritreaEstoniaEthiopiaEuro areaEurope & Central AsiaEurope & Central Asia (excluding high income)Europe & Central Asia (IDA & IBRD countries)European UnionFijiFinlandFragile and conflict affected situationsFranceGabonGambia, TheGeorgiaGermanyGhanaGibraltarGreeceGrenadaGuatemalaGuinea-BissauGuyanaHaitiHeavily indebted poor countries (HIPC)High incomeHondurasHong Kong SAR, ChinaHungaryIBRD onlyIcelandIDA & IBRD totalIDA blendIDA onlyIDA totalIndiaIndonesiaIran, Islamic Rep.IraqIrelandIsraelItalyJamaicaJapanJordanKazakhstanKenyaKiribatiKorea, Dem. People’s Rep.Korea, Rep.KosovoKuwaitKyrgyz RepublicLate-demographic dividendLatin America & Caribbean Latin America & Caribbean (excluding high income)Latin America & the Caribbean (IDA & IBRD countries)LatviaLeast developed countries: UN classificationLebanonLesothoLibyaLithuaniaLow & middle incomeLower middle incomeLuxembourgMacedonia, FYRMalaysiaMaldivesMaltaMarshall IslandsMauritiusMexicoMiddle East & North AfricaMiddle East & North Africa (excluding high income)Middle East & North Africa (IDA & IBRD countries)Middle incomeMoldovaMongoliaMontenegroMoroccoMozambiqueMyanmarNamibiaNepalNetherlandsNew ZealandNicaraguaNigerNigeriaNorth AmericaNorwayOECD membersOmanOther small statesPacific island small statesPakistanPalauPanamaParaguayPeruPhilippinesPolandPortugalPost-demographic dividendPre-demographic dividendQatarRomaniaRussian FederationSamoaSao Tome and PrincipeSaudi ArabiaSenegalSerbiaSeychellesSingaporeSlovak RepublicSloveniaSmall statesSolomon IslandsSouth AfricaSouth AsiaSouth Asia (IDA & IBRD)South SudanSpainSri LankaSt. Kitts and NevisSt. LuciaSt. Vincent and the GrenadinesSub-Saharan Africa Sub-Saharan Africa (excluding high income)Sub-Saharan Africa (IDA & IBRD countries)SudanSurinameSwazilandSwedenSwitzerlandSyrian Arab RepublicTajikistanTanzaniaThailandTimor-LesteTogoTongaTrinidad and TobagoTunisiaTurkeyTurkmenistanUkraineUnited Arab EmiratesUnited KingdomUnited StatesUpper middle incomeUruguayUzbekistanVanuatuVenezuela, RBVietnamWorldYemen, Rep.ZambiaZimbabwe Linha do tempo:
Nesta escala de tempo está apresentado um gráfico de 1972 ano até 2014 ano Congo, Rep.. Dados de 1971 ano ausente. O número de observações reais por data: 43.
Fonte (nome):
Indicadores de desenvolvimento mundial
Fonte (organização):
IEA Statistics © OECD/IEA 2014 (http://www.iea.org/stats/index.asp), subject to https://www.iea.org/t&c/termsandconditions/
Categorias:
Energy & Mining, Climate Change
Foi atualizado:
23 abr 2017 ano
Indicadores de alterações dos valores ao longo dos anos
Mínimo:
225.91
1 jan 2001 ano
Máximo:
555.788
1 jan 2014 ano
Na data de observação
Valor
Mudança absoluta
A alteração em relação ao valor anterior
1 jan 1972 ano
369.513
+369.513
0.0%
1 jan 1973 ano
371.117
+1.604
0.43%
1 jan 1974 ano
363.759
-7.358
-1.98%
1 jan 1975 ano
359.664
-4.095
-1.13%
1 jan 1976 ano
355.334
-4.33
-1.2%
1 jan 1977 ano
377.828
+22.494
6.33%
1 jan 1978 ano
349.089
-28.739
-7.61%
1 jan 1979 ano
352.235
+3.146
0.9%
1 jan 1980 ano
341.87
-10.365
-2.94%
1 jan 1981 ano
343.996
+2.126
0.62%
1 jan 1982 ano
344.345
+0.349
0.1%
1 jan 1983 ano
355.098
+10.753
3.12%
1 jan 1984 ano
383.535
+28.437
8.01%
1 jan 1985 ano
361.527
-22.008
-5.74%
1 jan 1986 ano
366.4
+4.873
1.35%
1 jan 1987 ano
350.604
-15.796
-4.31%
1 jan 1988 ano
347.182
-3.422
-0.98%
1 jan 1989 ano
325.585
-21.597
-6.22%
1 jan 1990 ano
331.035
+5.45
1.67%
1 jan 1991 ano
325.025
-6.01
-1.82%
1 jan 1992 ano
325.188
+0.163
0.05%
1 jan 1993 ano
317.469
-7.72
-2.37%
1 jan 1994 ano
312.824
-4.645
-1.46%
1 jan 1995 ano
274.913
-37.911
-12.12%
1 jan 1996 ano
284.836
+9.923
3.61%
1 jan 1997 ano
271.186
-13.649
-4.79%
1 jan 1998 ano
252.125
-19.061
-7.03%
1 jan 1999 ano
246.287
-5.838
-2.32%
1 jan 2000 ano
233.676
-12.611
-5.12%
1 jan 2001 ano
225.91
-7.766
-3.32%
1 jan 2002 ano
247.253
+21.343
9.45%
1 jan 2003 ano
243.17
-4.083
-1.65%
1 jan 2004 ano
283.567
+40.397
16.61%
1 jan 2005 ano
289.954
+6.387
2.25%
1 jan 2006 ano
307.454
+17.5
6.04%
1 jan 2007 ano
391.714
+84.26
27.41%
1 jan 2008 ano
338.481
-53.233
-13.59%
1 jan 2009 ano
349.225
+10.744
3.17%
1 jan 2010 ano
386.933
+37.708
10.8%
1 jan 2011 ano
408.705
+21.772
5.63%
1 jan 2012 ano
532.359
+123.654
30.26%
1 jan 2013 ano
552.25
+19.891
3.74%
1 jan 2014 ano
555.788
+3.538
0.64%
Classificação de países por estatísticas atuais por anos


Comentários: