29
/pt/
pt
AIzaSyAYiBZKx7MnpbEhh9jyipgxe19OcubqV5w
April 1, 2024
108553
Comoros
COM
true
2
1
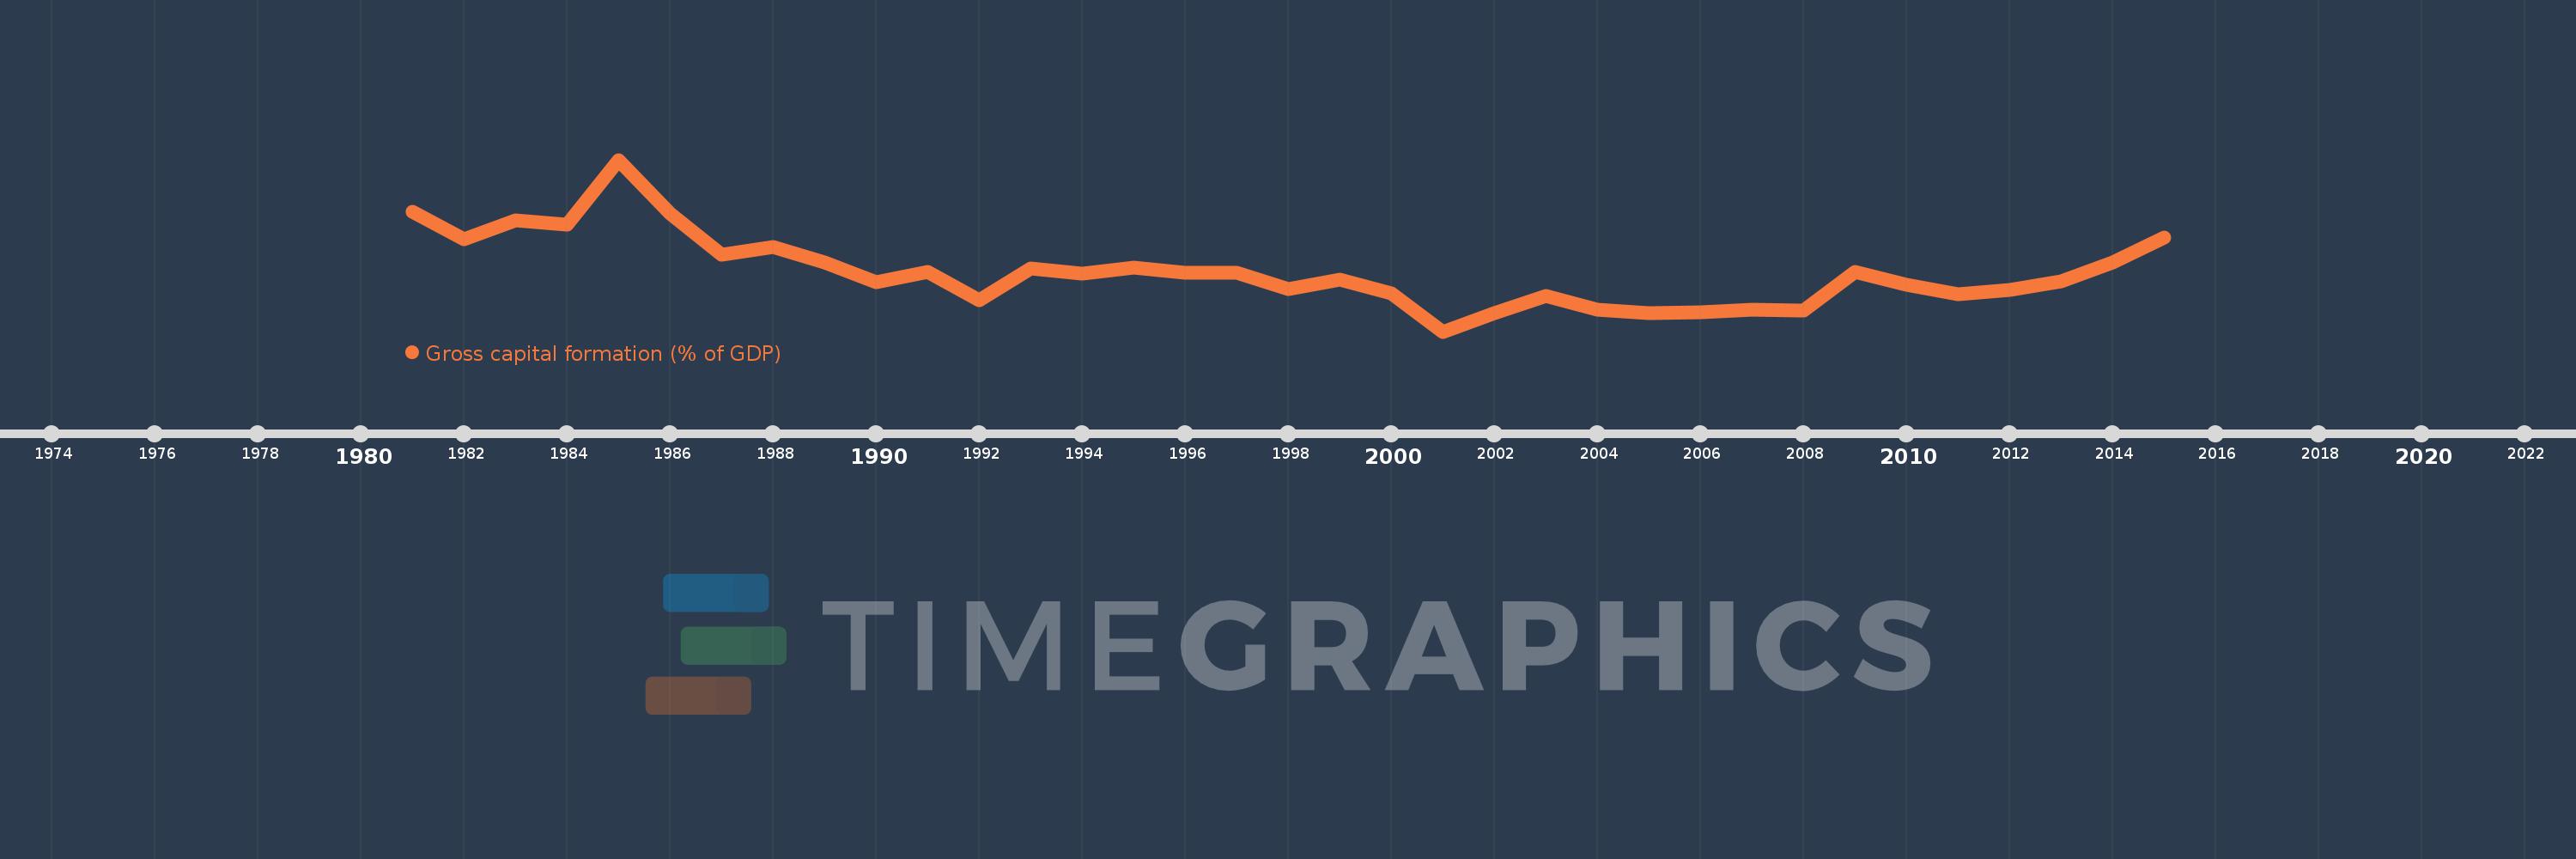
Gross capital formation (% of GDP)
2015,2014,2013,2012,2011,2010,2009,2008,2007,2006,2005,2004,2003,2002,2001,2000,1999,1998,1997,1996,1995,1994,1993,1992,1991,1990,1989,1988,1987,1986,1985,1984,1983,1982,1981
Estas estatísticas em outros países:
AfghanistanAlbaniaAlgeriaAngolaAntigua and BarbudaArab WorldArgentinaArmeniaArubaAustraliaAustriaAzerbaijanBahamas, TheBahrainBangladeshBarbadosBelarusBelgiumBelizeBeninBermudaBhutanBoliviaBosnia and HerzegovinaBotswanaBrazilBrunei DarussalamBulgariaBurkina FasoBurundiCabo VerdeCambodiaCameroonCanadaCaribbean small statesCentral African RepublicCentral Europe and the BalticsChadChileChinaColombiaComorosCongo, Dem. Rep.Congo, Rep.Costa RicaCote d'IvoireCroatiaCubaCyprusCzech RepublicDenmarkDjiboutiDominicaDominican RepublicEarly-demographic dividendEast Asia & PacificEast Asia & Pacific (excluding high income)East Asia & Pacific (IDA & IBRD countries)EcuadorEgypt, Arab Rep.El SalvadorEquatorial GuineaEritreaEstoniaEthiopiaEuro areaEurope & Central AsiaEurope & Central Asia (excluding high income)Europe & Central Asia (IDA & IBRD countries)European UnionFaroe IslandsFijiFinlandFragile and conflict affected situationsFranceGabonGambia, TheGeorgiaGermanyGhanaGreeceGrenadaGuatemalaGuineaGuinea-BissauGuyanaHaitiHeavily indebted poor countries (HIPC)High incomeHondurasHong Kong SAR, ChinaHungaryIBRD onlyIcelandIDA & IBRD totalIDA blendIDA onlyIDA totalIndiaIndonesiaIran, Islamic Rep.IraqIrelandIsraelItalyJamaicaJapanJordanKazakhstanKenyaKiribatiKorea, Rep.KosovoKuwaitKyrgyz RepublicLao PDRLate-demographic dividendLatin America & Caribbean Latin America & Caribbean (excluding high income)Latin America & the Caribbean (IDA & IBRD countries)LatviaLeast developed countries: UN classificationLebanonLesothoLiberiaLibyaLithuaniaLow & middle incomeLow incomeLower middle incomeLuxembourgMacao SAR, ChinaMacedonia, FYRMadagascarMalawiMalaysiaMaldivesMaliMaltaMauritaniaMauritiusMexicoMicronesia, Fed. Sts.Middle East & North AfricaMiddle East & North Africa (excluding high income)Middle East & North Africa (IDA & IBRD countries)Middle incomeMoldovaMongoliaMontenegroMoroccoMozambiqueNamibiaNepalNetherlandsNew CaledoniaNew ZealandNicaraguaNigerNigeriaNorth AmericaNorwayOECD membersOmanOther small statesPacific island small statesPakistanPanamaPapua New GuineaParaguayPeruPhilippinesPolandPortugalPost-demographic dividendPre-demographic dividendPuerto RicoQatarRomaniaRussian FederationRwandaSaudi ArabiaSenegalSerbiaSeychellesSierra LeoneSingaporeSlovak RepublicSloveniaSmall statesSolomon IslandsSomaliaSouth AfricaSouth AsiaSouth Asia (IDA & IBRD)South SudanSpainSri LankaSt. Kitts and NevisSt. LuciaSt. Vincent and the GrenadinesSub-Saharan Africa Sub-Saharan Africa (excluding high income)Sub-Saharan Africa (IDA & IBRD countries)SudanSurinameSwazilandSwedenSwitzerlandSyrian Arab RepublicTajikistanTanzaniaThailandTimor-LesteTogoTongaTrinidad and TobagoTunisiaTurkeyTurkmenistanUgandaUkraineUnited Arab EmiratesUnited KingdomUnited StatesUpper middle incomeUruguayUzbekistanVanuatuVenezuela, RBVietnamWest Bank and GazaWorldYemen, Rep.ZambiaZimbabwe Linha do tempo:
Nesta escala de tempo está apresentado um gráfico de 1981 ano até 2015 ano Comoros. Dados de 1980 ano ausente. O número de observações reais por data: 35.
Fonte (nome):
Indicadores de desenvolvimento mundial
Fonte (organização):
World Bank national accounts data, and OECD National Accounts data files.
Categorias:
Economy & Growth
Foi atualizado:
23 abr 2017 ano
Indicadores de alterações dos valores ao longo dos anos
Mínimo:
6.258
1 jan 2001 ano
Máximo:
44.96
1 jan 1985 ano
Na data de observação
Valor
Mudança absoluta
A alteração em relação ao valor anterior
1 jan 1981 ano
33.169
+33.169
0.0%
1 jan 1982 ano
26.988
-6.181
-18.63%
1 jan 1983 ano
31.384
+4.396
16.29%
1 jan 1984 ano
30.264
-1.12
-3.57%
1 jan 1985 ano
44.96
+14.696
48.56%
1 jan 1986 ano
32.792
-12.168
-27.06%
1 jan 1987 ano
23.588
-9.204
-28.07%
1 jan 1988 ano
25.246
+1.658
7.03%
1 jan 1989 ano
21.835
-3.411
-13.51%
1 jan 1990 ano
17.395
-4.44
-20.33%
1 jan 1991 ano
19.667
+2.272
13.06%
1 jan 1992 ano
13.241
-6.425
-32.67%
1 jan 1993 ano
20.523
+7.281
54.99%
1 jan 1994 ano
19.304
-1.219
-5.94%
1 jan 1995 ano
20.684
+1.38
7.15%
1 jan 1996 ano
19.457
-1.227
-5.93%
1 jan 1997 ano
19.421
-0.036
-0.19%
1 jan 1998 ano
15.848
-3.573
-18.4%
1 jan 1999 ano
17.954
+2.107
13.29%
1 jan 2000 ano
14.96
-2.994
-16.68%
1 jan 2001 ano
6.258
-8.702
-58.17%
1 jan 2002 ano
10.341
+4.083
65.25%
1 jan 2003 ano
14.322
+3.981
38.5%
1 jan 2004 ano
11.128
-3.194
-22.3%
1 jan 2005 ano
10.403
-0.725
-6.51%
1 jan 2006 ano
10.562
+0.16
1.53%
1 jan 2007 ano
11.266
+0.704
6.66%
1 jan 2008 ano
11.067
-0.199
-1.77%
1 jan 2009 ano
19.767
+8.7
78.61%
1 jan 2010 ano
16.813
-2.954
-14.95%
1 jan 2011 ano
14.748
-2.064
-12.28%
1 jan 2012 ano
15.588
+0.84
5.7%
1 jan 2013 ano
17.672
+2.084
13.37%
1 jan 2014 ano
21.768
+4.095
23.17%
1 jan 2015 ano
27.358
+5.591
25.68%
Classificação de países por estatísticas atuais por anos


Comentários: