29
/pt/
pt
AIzaSyAYiBZKx7MnpbEhh9jyipgxe19OcubqV5w
April 1, 2024
107135
Colombia
COL
true
2
1
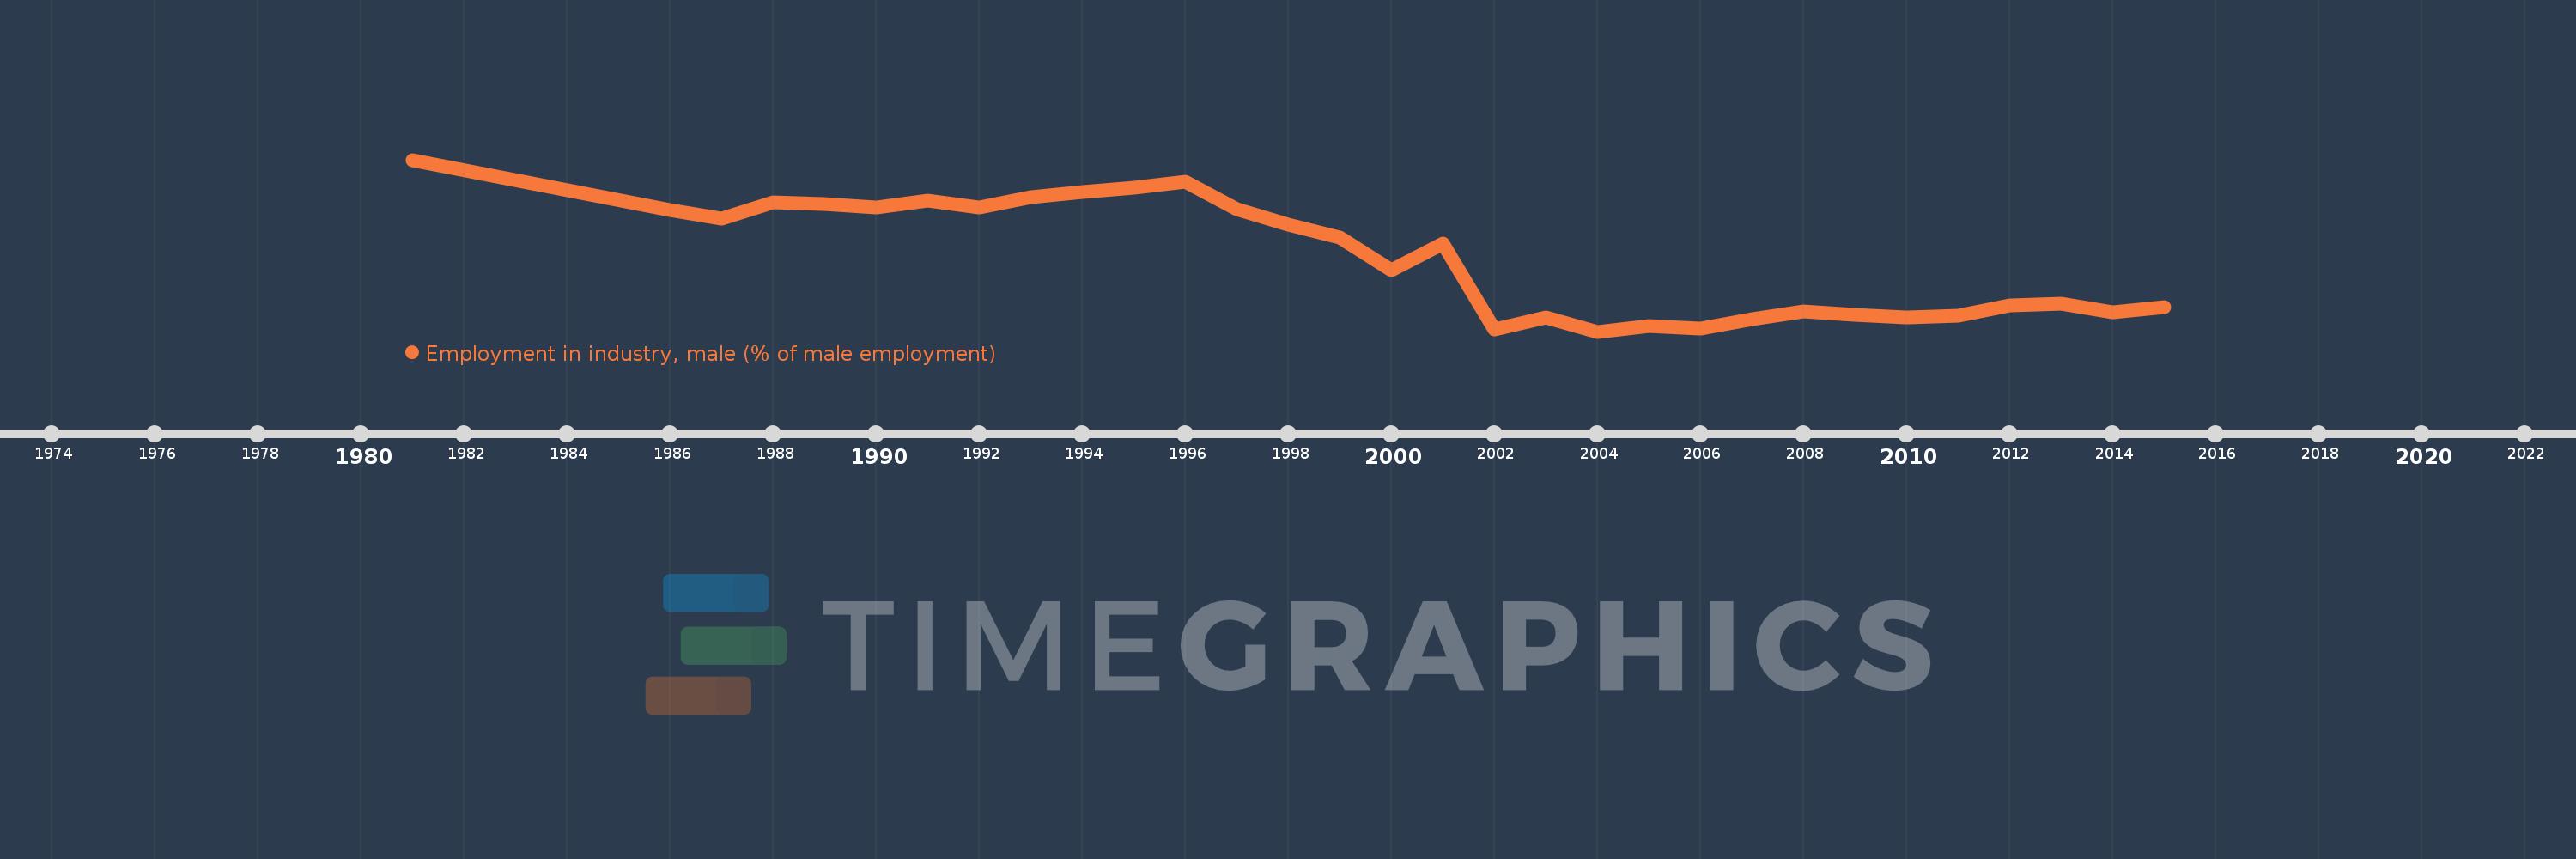
Employment in industry, male (% of male employment)
2015,2014,2013,2012,2011,2010,2009,2008,2007,2006,2005,2004,2003,2002,2001,2000,1999,1998,1997,1996,1995,1994,1993,1992,1991,1990,1989,1988,1987,1986,1981
Estas estatísticas em outros países:
AlbaniaAlgeriaAmerican SamoaAntigua and BarbudaArab WorldArgentinaArmeniaArubaAustraliaAustriaAzerbaijanBahamas, TheBahrainBangladeshBarbadosBelarusBelgiumBelizeBeninBermudaBhutanBoliviaBotswanaBrazilBritish Virgin IslandsBrunei DarussalamBulgariaBurkina FasoBurundiCambodiaCameroonCanadaCaribbean small statesCayman IslandsCentral Europe and the BalticsChadChileChinaColombiaCongo, Rep.Costa RicaCroatiaCubaCyprusCzech RepublicDenmarkDominicaDominican RepublicEarly-demographic dividendEast Asia & PacificEast Asia & Pacific (excluding high income)East Asia & Pacific (IDA & IBRD countries)EcuadorEgypt, Arab Rep.El SalvadorEquatorial GuineaEstoniaEthiopiaEuro areaEurope & Central AsiaEurope & Central Asia (excluding high income)Europe & Central Asia (IDA & IBRD countries)European UnionFaroe IslandsFijiFinlandFranceGabonGambia, TheGeorgiaGermanyGhanaGreeceGreenlandGrenadaGuatemalaGuineaGuyanaHaitiHigh incomeHondurasHong Kong SAR, ChinaHungaryIBRD onlyIcelandIDA & IBRD totalIDA blendIndiaIndonesiaIran, Islamic Rep.IraqIrelandIsle of ManIsraelItalyJamaicaJapanJordanKazakhstanKenyaKiribatiKorea, Rep.KosovoKuwaitKyrgyz RepublicLao PDRLate-demographic dividendLatin America & Caribbean Latin America & Caribbean (excluding high income)Latin America & the Caribbean (IDA & IBRD countries)LatviaLesothoLiberiaLithuaniaLow & middle incomeLower middle incomeLuxembourgMacao SAR, ChinaMacedonia, FYRMadagascarMalawiMalaysiaMaldivesMaliMaltaMarshall IslandsMauritiusMexicoMiddle East & North AfricaMiddle East & North Africa (excluding high income)Middle East & North Africa (IDA & IBRD countries)Middle incomeMoldovaMongoliaMontenegroMoroccoMozambiqueNamibiaNepalNetherlandsNew CaledoniaNew ZealandNicaraguaNigerNigeriaNorth AmericaNorthern Mariana IslandsNorwayOECD membersOmanPakistanPalauPanamaParaguayPeruPhilippinesPolandPortugalPost-demographic dividendPuerto RicoQatarRomaniaRussian FederationRwandaSamoaSan MarinoSao Tome and PrincipeSaudi ArabiaSenegalSerbiaSeychellesSierra LeoneSingaporeSlovak RepublicSloveniaSouth AfricaSouth AsiaSouth Asia (IDA & IBRD)SpainSri LankaSt. Kitts and NevisSt. LuciaSt. Vincent and the GrenadinesSudanSurinameSwedenSwitzerlandSyrian Arab RepublicTajikistanTanzaniaThailandTimor-LesteTogoTongaTrinidad and TobagoTunisiaTurkeyUgandaUkraineUnited Arab EmiratesUnited KingdomUnited StatesUpper middle incomeUruguayVanuatuVenezuela, RBVietnamWest Bank and GazaWorldYemen, Rep.ZambiaZimbabwe Linha do tempo:
Nesta escala de tempo está apresentado um gráfico de 1981 ano até 2015 ano Colombia. Dados de 1980 ano ausente. O número de observações reais por data: 31.
Fonte (nome):
Indicadores de desenvolvimento mundial
Fonte (organização):
International Labour Organization, Key Indicators of the Labour Market database.
Categorias:
Social Protection & Labor, Gender
Foi atualizado:
23 abr 2017 ano
Indicadores de alterações dos valores ao longo dos anos
Mínimo:
20.9
1 jan 2004 ano
Máximo:
39.0
1 jan 1981 ano
Na data de observação
Valor
Mudança absoluta
A alteração em relação ao valor anterior
1 jan 1981 ano
39.0
+39.0
0.0%
1 jan 1986 ano
33.7
-5.3
-13.59%
1 jan 1987 ano
32.8
-0.9
-2.67%
1 jan 1988 ano
34.5
+1.7
5.18%
1 jan 1989 ano
34.3
-0.2
-0.58%
1 jan 1990 ano
34.0
-0.3
-0.87%
1 jan 1991 ano
34.7
+0.7
2.06%
1 jan 1992 ano
34.0
-0.7
-2.02%
1 jan 1993 ano
35.1
+1.1
3.24%
1 jan 1994 ano
35.6
+0.5
1.42%
1 jan 1995 ano
36.1
+0.5
1.4%
1 jan 1996 ano
36.7
+0.6
1.66%
1 jan 1997 ano
33.8
-2.9
-7.9%
1 jan 1998 ano
32.2
-1.6
-4.73%
1 jan 1999 ano
30.8
-1.4
-4.35%
1 jan 2000 ano
27.4
-3.4
-11.04%
1 jan 2001 ano
30.2
+2.8
10.22%
1 jan 2002 ano
21.1
-9.1
-30.13%
1 jan 2003 ano
22.4
+1.3
6.16%
1 jan 2004 ano
20.9
-1.5
-6.7%
1 jan 2005 ano
21.5
+0.6
2.87%
1 jan 2006 ano
21.2
-0.3
-1.4%
1 jan 2007 ano
22.2
+1.0
4.72%
1 jan 2008 ano
23.0
+0.8
3.6%
1 jan 2009 ano
22.7
-0.3
-1.3%
1 jan 2010 ano
22.4
-0.3
-1.32%
1 jan 2011 ano
22.6
+0.2
0.89%
1 jan 2012 ano
23.7
+1.1
4.87%
1 jan 2013 ano
23.8
+0.1
0.42%
1 jan 2014 ano
22.9
-0.9
-3.78%
1 jan 2015 ano
23.5
+0.6
2.62%
Classificação de países por estatísticas atuais por anos


Comentários: