29
/pt/
pt
AIzaSyAYiBZKx7MnpbEhh9jyipgxe19OcubqV5w
April 1, 2024
102715
Central African Republic
CAF
true
2
1
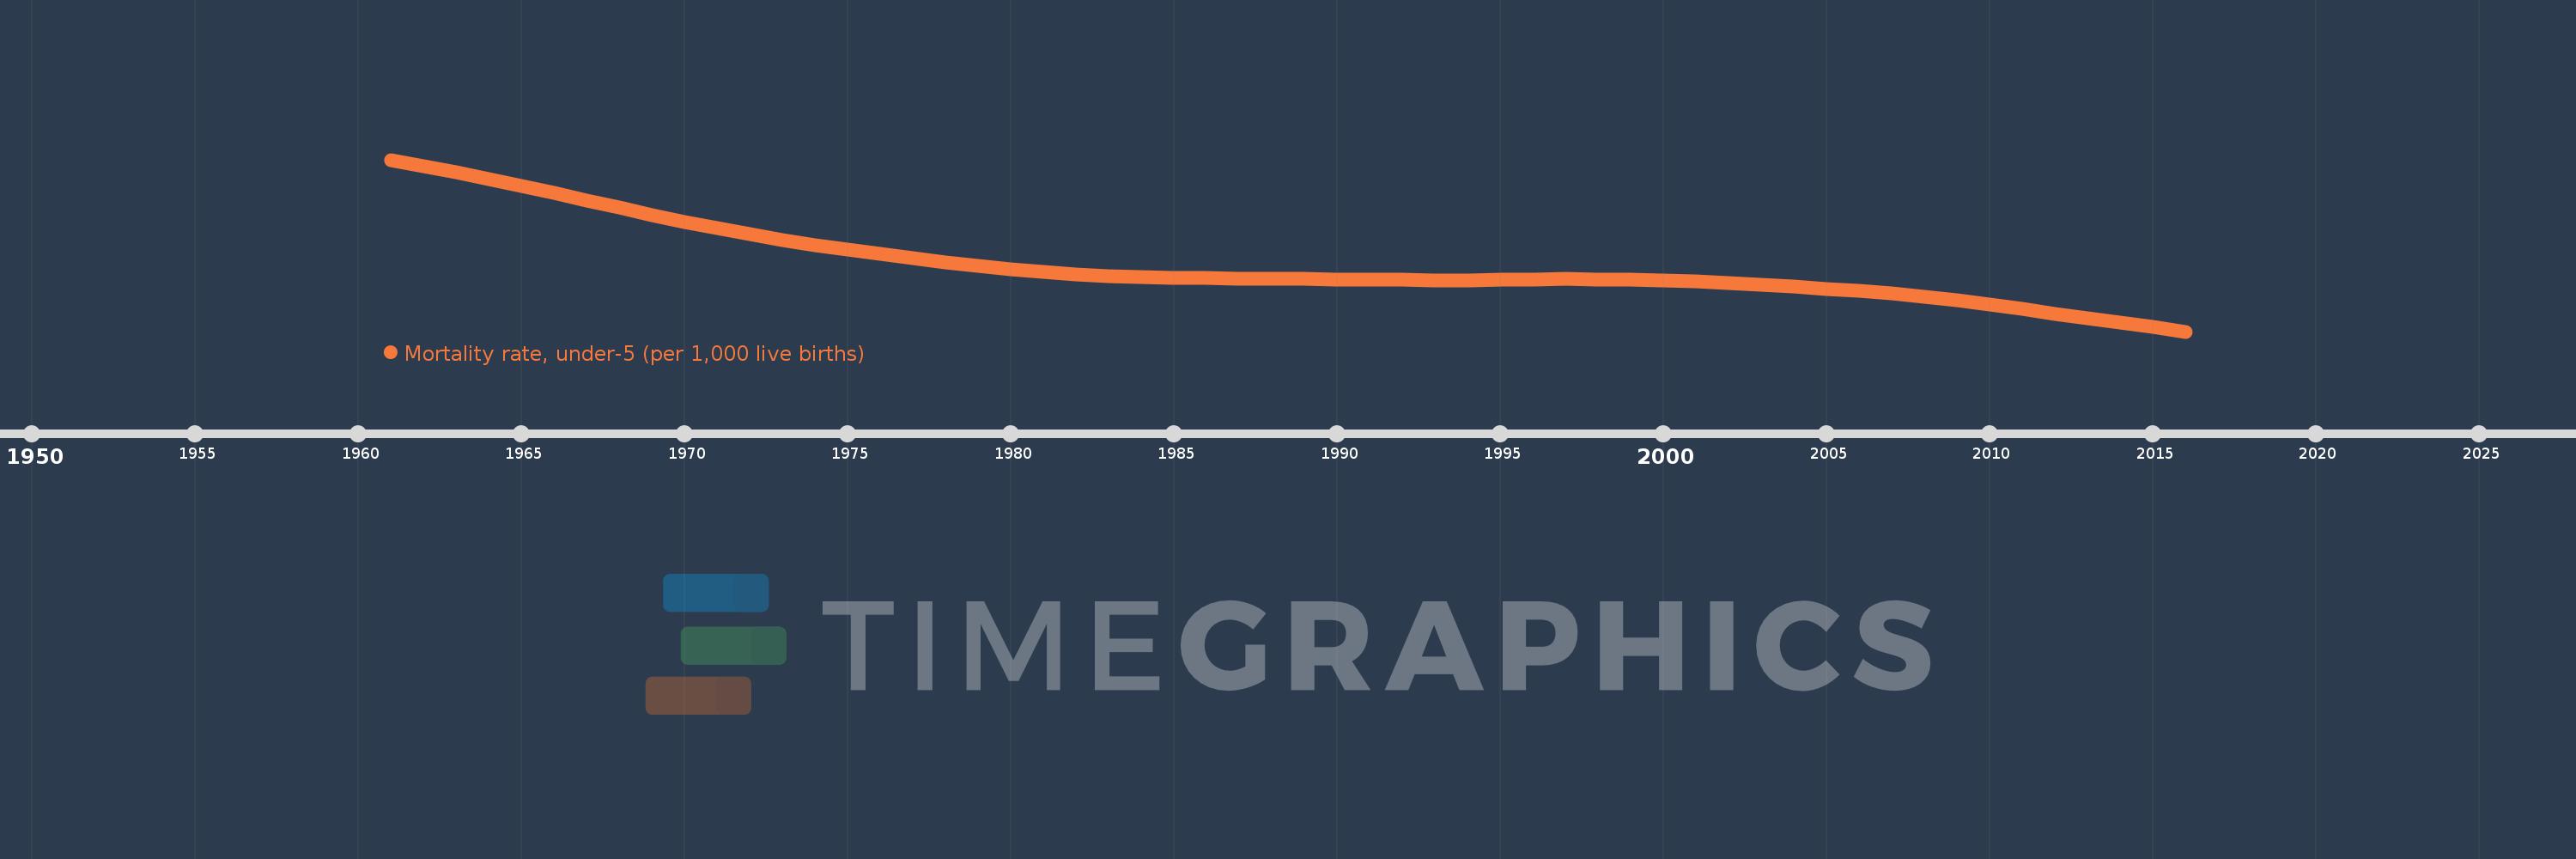
Mortality rate, under-5 (per 1,000 live births)
2016,2015,2014,2013,2012,2011,2010,2009,2008,2007,2006,2005,2004,2003,2002,2001,2000,1999,1998,1997,1996,1995,1994,1993,1992,1991,1990,1989,1988,1987,1986,1985,1984,1983,1982,1981,1980,1979,1978,1977,1976,1975,1974,1973,1972,1971,1970,1969,1968,1967,1966,1965,1964,1963,1962,1961
Estas estatísticas em outros países:
AfghanistanAlbaniaAlgeriaAndorraAngolaAntigua and BarbudaArab WorldArgentinaArmeniaAustraliaAustriaAzerbaijanBahamas, TheBahrainBangladeshBarbadosBelarusBelgiumBelizeBeninBhutanBoliviaBosnia and HerzegovinaBotswanaBrazilBrunei DarussalamBulgariaBurkina FasoBurundiCabo VerdeCambodiaCameroonCanadaCaribbean small statesCentral African RepublicCentral Europe and the BalticsChadChileChinaColombiaComorosCongo, Dem. Rep.Congo, Rep.Costa RicaCote d'IvoireCroatiaCubaCyprusCzech RepublicDenmarkDjiboutiDominicaDominican RepublicEarly-demographic dividendEast Asia & PacificEast Asia & Pacific (excluding high income)East Asia & Pacific (IDA & IBRD countries)EcuadorEgypt, Arab Rep.El SalvadorEquatorial GuineaEritreaEstoniaEthiopiaEuro areaEurope & Central AsiaEurope & Central Asia (excluding high income)Europe & Central Asia (IDA & IBRD countries)European UnionFijiFinlandFragile and conflict affected situationsFranceGabonGambia, TheGeorgiaGermanyGhanaGreeceGrenadaGuatemalaGuineaGuinea-BissauGuyanaHaitiHeavily indebted poor countries (HIPC)High incomeHondurasHungaryIBRD onlyIcelandIDA & IBRD totalIDA blendIDA onlyIDA totalIndiaIndonesiaIran, Islamic Rep.IraqIrelandIsraelItalyJamaicaJapanJordanKazakhstanKenyaKiribatiKorea, Dem. People’s Rep.Korea, Rep.KuwaitKyrgyz RepublicLao PDRLate-demographic dividendLatin America & Caribbean Latin America & Caribbean (excluding high income)Latin America & the Caribbean (IDA & IBRD countries)LatviaLeast developed countries: UN classificationLebanonLesothoLiberiaLibyaLithuaniaLow & middle incomeLow incomeLower middle incomeLuxembourgMacedonia, FYRMadagascarMalawiMalaysiaMaldivesMaliMaltaMarshall IslandsMauritaniaMauritiusMexicoMicronesia, Fed. Sts.Middle East & North AfricaMiddle East & North Africa (excluding high income)Middle East & North Africa (IDA & IBRD countries)Middle incomeMoldovaMonacoMongoliaMontenegroMoroccoMozambiqueMyanmarNamibiaNauruNepalNetherlandsNew ZealandNicaraguaNigerNigeriaNorth AmericaNorwayOECD membersOmanOther small statesPacific island small statesPakistanPalauPanamaPapua New GuineaParaguayPeruPhilippinesPolandPortugalPost-demographic dividendPre-demographic dividendQatarRomaniaRussian FederationRwandaSamoaSan MarinoSao Tome and PrincipeSaudi ArabiaSenegalSerbiaSeychellesSierra LeoneSingaporeSlovak RepublicSloveniaSmall statesSolomon IslandsSomaliaSouth AfricaSouth AsiaSouth Asia (IDA & IBRD)South SudanSpainSri LankaSt. Kitts and NevisSt. LuciaSt. Vincent and the GrenadinesSub-Saharan Africa Sub-Saharan Africa (excluding high income)Sub-Saharan Africa (IDA & IBRD countries)SudanSurinameSwazilandSwedenSwitzerlandSyrian Arab RepublicTajikistanTanzaniaThailandTimor-LesteTogoTongaTrinidad and TobagoTunisiaTurkeyTurkmenistanTuvaluUgandaUkraineUnited Arab EmiratesUnited KingdomUnited StatesUpper middle incomeUruguayUzbekistanVanuatuVenezuela, RBVietnamWest Bank and GazaWorldYemen, Rep.ZambiaZimbabwe Linha do tempo:
Nesta escala de tempo está apresentado um gráfico de 1961 ano até 2016 ano Central African Republic. Dados de 1960 ano ausente. O número de observações reais por data: 56.
Fonte (nome):
Indicadores de desenvolvimento mundial
Fonte (organização):
Estimates Developed by the UN Inter-agency Group for Child Mortality Estimation (UNICEF, WHO, World Bank, UN DESA Population Division) at www.childmortality.org. Projected data are from the United Nations Population Division's World Population Prospects; and may in some cases not be consistent with data before the current year.
Categorias:
Health, Aid Effectiveness, Climate Change
Foi atualizado:
23 abr 2017 ano
Indicadores de alterações dos valores ao longo dos anos
Mínimo:
130.1
1 jan 2016 ano
Máximo:
283.7
1 jan 1961 ano
Na data de observação
Valor
Mudança absoluta
A alteração em relação ao valor anterior
1 jan 1961 ano
283.7
+283.7
0.0%
1 jan 1962 ano
278.1
-5.6
-1.97%
1 jan 1963 ano
272.6
-5.5
-1.98%
1 jan 1964 ano
266.5
-6.1
-2.24%
1 jan 1965 ano
260.4
-6.1
-2.29%
1 jan 1966 ano
253.9
-6.5
-2.5%
1 jan 1967 ano
247.1
-6.8
-2.68%
1 jan 1968 ano
240.7
-6.4
-2.59%
1 jan 1969 ano
234.2
-6.5
-2.7%
1 jan 1970 ano
228.2
-6.0
-2.56%
1 jan 1971 ano
222.5
-5.7
-2.5%
1 jan 1972 ano
217.1
-5.4
-2.43%
1 jan 1973 ano
212.1
-5.0
-2.3%
1 jan 1974 ano
207.5
-4.6
-2.17%
1 jan 1975 ano
203.3
-4.2
-2.02%
1 jan 1976 ano
199.3
-4.0
-1.97%
1 jan 1977 ano
195.7
-3.6
-1.81%
1 jan 1978 ano
192.3
-3.4
-1.74%
1 jan 1979 ano
189.0
-3.3
-1.72%
1 jan 1980 ano
186.1
-2.9
-1.53%
1 jan 1981 ano
183.5
-2.6
-1.4%
1 jan 1982 ano
181.5
-2.0
-1.09%
1 jan 1983 ano
180.0
-1.5
-0.83%
1 jan 1984 ano
178.9
-1.1
-0.61%
1 jan 1985 ano
178.2
-0.7
-0.39%
1 jan 1986 ano
177.8
-0.4
-0.22%
1 jan 1987 ano
177.4
-0.4
-0.22%
1 jan 1988 ano
177.2
-0.2
-0.11%
1 jan 1989 ano
177.0
-0.2
-0.11%
1 jan 1990 ano
176.8
-0.2
-0.11%
1 jan 1991 ano
176.5
-0.3
-0.17%
1 jan 1992 ano
176.2
-0.3
-0.17%
1 jan 1993 ano
176.0
-0.2
-0.11%
1 jan 1994 ano
176.1
+0.1
0.06%
1 jan 1995 ano
176.4
+0.3
0.17%
1 jan 1996 ano
176.7
+0.3
0.17%
1 jan 1997 ano
177.0
+0.3
0.17%
1 jan 1998 ano
176.9
-0.1
-0.06%
1 jan 1999 ano
176.5
-0.4
-0.23%
1 jan 2000 ano
175.7
-0.8
-0.45%
1 jan 2001 ano
174.8
-0.9
-0.51%
1 jan 2002 ano
173.5
-1.3
-0.74%
1 jan 2003 ano
171.9
-1.6
-0.92%
1 jan 2004 ano
170.3
-1.6
-0.93%
1 jan 2005 ano
168.4
-1.9
-1.12%
1 jan 2006 ano
166.2
-2.2
-1.31%
1 jan 2007 ano
163.9
-2.3
-1.38%
1 jan 2008 ano
161.3
-2.6
-1.59%
1 jan 2009 ano
158.2
-3.1
-1.92%
1 jan 2010 ano
154.2
-4.0
-2.53%
1 jan 2011 ano
150.2
-4.0
-2.59%
1 jan 2012 ano
146.2
-4.0
-2.66%
1 jan 2013 ano
142.1
-4.1
-2.8%
1 jan 2014 ano
138.5
-3.6
-2.53%
1 jan 2015 ano
134.0
-4.5
-3.25%
1 jan 2016 ano
130.1
-3.9
-2.91%
Classificação de países por estatísticas atuais por anos


Comentários: