29
/it/
it
AIzaSyAYiBZKx7MnpbEhh9jyipgxe19OcubqV5w
April 1, 2024
99943
Cameroon
CMR
true
2
1
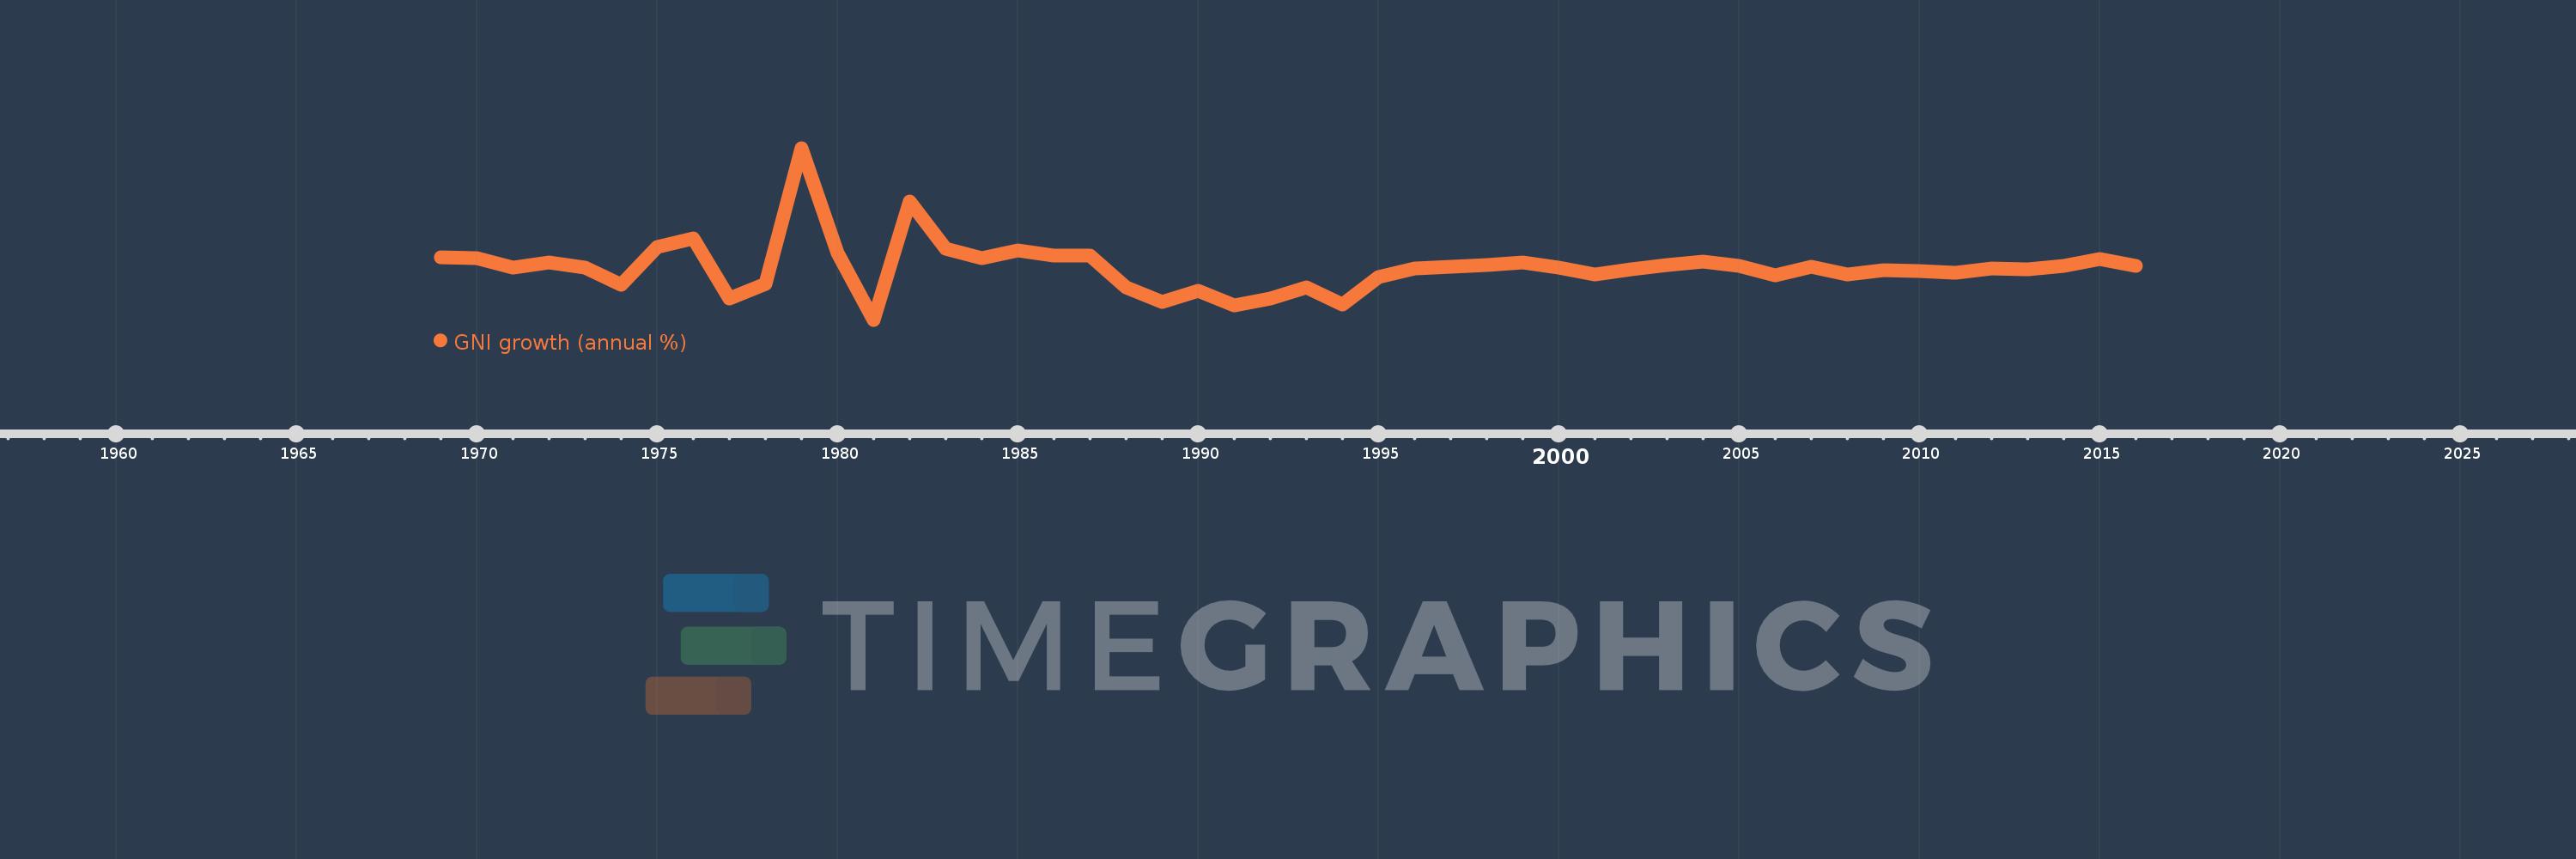
GNI growth (annual %)
2016,2015,2014,2013,2012,2011,2010,2009,2008,2007,2006,2005,2004,2003,2002,2001,2000,1999,1998,1997,1996,1995,1994,1993,1992,1991,1990,1989,1988,1987,1986,1985,1984,1983,1982,1981,1980,1979,1978,1977,1976,1975,1974,1973,1972,1971,1970,1969
Queste statistiche in altri paesi:
AlbaniaAlgeriaAngolaAntigua and BarbudaArab WorldArgentinaArmeniaAustraliaAustriaAzerbaijanBahamas, TheBahrainBangladeshBarbadosBelarusBelgiumBelizeBeninBhutanBoliviaBosnia and HerzegovinaBotswanaBrazilBrunei DarussalamBulgariaBurkina FasoBurundiCabo VerdeCambodiaCameroonCanadaCaribbean small statesCentral Europe and the BalticsChadChileChinaColombiaComorosCongo, Dem. Rep.Congo, Rep.Costa RicaCote d'IvoireCroatiaCubaCyprusCzech RepublicDenmarkDjiboutiDominican RepublicEarly-demographic dividendEast Asia & PacificEast Asia & Pacific (excluding high income)East Asia & Pacific (IDA & IBRD countries)EcuadorEgypt, Arab Rep.El SalvadorEquatorial GuineaEritreaEstoniaEthiopiaEuro areaEurope & Central AsiaEurope & Central Asia (excluding high income)Europe & Central Asia (IDA & IBRD countries)European UnionFijiFinlandFranceGabonGambia, TheGeorgiaGermanyGhanaGreeceGuatemalaGuineaGuinea-BissauHaitiHeavily indebted poor countries (HIPC)High incomeHondurasHong Kong SAR, ChinaHungaryIBRD onlyIcelandIDA & IBRD totalIDA blendIDA onlyIDA totalIndiaIndonesiaIran, Islamic Rep.IrelandIsraelItalyJamaicaJapanJordanKazakhstanKenyaKorea, Rep.KosovoKuwaitKyrgyz RepublicLao PDRLate-demographic dividendLatin America & Caribbean Latin America & Caribbean (excluding high income)Latin America & the Caribbean (IDA & IBRD countries)LatviaLeast developed countries: UN classificationLebanonLiberiaLibyaLithuaniaLow & middle incomeLow incomeLower middle incomeLuxembourgMacao SAR, ChinaMacedonia, FYRMadagascarMalawiMalaysiaMaliMaltaMauritaniaMauritiusMexicoMiddle East & North AfricaMiddle East & North Africa (excluding high income)Middle East & North Africa (IDA & IBRD countries)Middle incomeMoldovaMongoliaMontenegroMoroccoMozambiqueMyanmarNamibiaNepalNetherlandsNew ZealandNicaraguaNigerNigeriaNorth AmericaNorwayOECD membersOmanOther small statesPakistanPanamaPapua New GuineaParaguayPeruPhilippinesPolandPortugalPost-demographic dividendPre-demographic dividendPuerto RicoQatarRomaniaRussian FederationRwandaSamoaSaudi ArabiaSenegalSerbiaSeychellesSierra LeoneSingaporeSlovak RepublicSloveniaSmall statesSomaliaSouth AfricaSouth AsiaSouth Asia (IDA & IBRD)South SudanSpainSri LankaSub-Saharan Africa Sub-Saharan Africa (excluding high income)Sub-Saharan Africa (IDA & IBRD countries)SudanSurinameSwazilandSwedenSwitzerlandSyrian Arab RepublicTajikistanTanzaniaThailandTimor-LesteTogoTrinidad and TobagoTunisiaTurkeyTurkmenistanUgandaUkraineUnited Arab EmiratesUnited KingdomUnited StatesUpper middle incomeUruguayUzbekistanVanuatuVenezuela, RBVietnamWest Bank and GazaWorldZambiaZimbabwe Linea del tempo:
Questa scala temporale mostra un grafico dal 1969 anno al 2016 anno. Cameroon. I dati fino ad 1968 anno non disponibili. Il numero di osservazioni attuali secondo i date: 48.
La fonte (nome):
Indicatori dello sviluppo mondiale
La fonte (organizzazione):
World Bank national accounts data, and OECD National Accounts data files.
Categorie:
Economy & Growth
sono stati aggiornati
23 apr 2017 anni
Indicatori delle variazioni dei valori per anni
Minima:
-13.055
1 gen 1981 anni
Massimo:
44.691
1 gen 1979 anni
Alla data di osservazione
Valore
Variazione assoluta
La variazione rispetto al valore precedente
1 gen 1969 anni
8.044
+8.044
0.0%
1 gen 1970 anni
7.628
-0.415
-5.16%
1 gen 1971 anni
4.489
-3.139
-41.15%
1 gen 1972 anni
6.325
+1.836
40.91%
1 gen 1973 anni
4.464
-1.861
-29.42%
1 gen 1974 anni
-1.34
-5.804
-130.01%
1 gen 1975 anni
11.331
+12.671
-945.72%
1 gen 1976 anni
14.3
+2.969
26.21%
1 gen 1977 anni
-5.797
-20.097
-140.54%
1 gen 1978 anni
-0.972
+4.824
-83.23%
1 gen 1979 anni
44.691
+45.663
-4.7 Mille.%
1 gen 1980 anni
9.323
-35.368
-79.14%
1 gen 1981 anni
-13.055
-22.378
-240.03%
1 gen 1982 anni
26.688
+39.743
-304.43%
1 gen 1983 anni
10.907
-15.782
-59.13%
1 gen 1984 anni
7.576
-3.331
-30.54%
1 gen 1985 anni
10.163
+2.587
34.15%
1 gen 1986 anni
8.5
-1.663
-16.36%
1 gen 1987 anni
8.628
+0.128
1.51%
1 gen 1988 anni
-2.11
-10.738
-124.45%
1 gen 1989 anni
-6.966
-4.857
230.22%
1 gen 1990 anni
-3.272
+3.694
-53.04%
1 gen 1991 anni
-8.299
-5.028
153.67%
1 gen 1992 anni
-5.911
+2.389
-28.78%
1 gen 1993 anni
-2.068
+3.843
-65.01%
1 gen 1994 anni
-8.071
-6.003
290.3%
1 gen 1995 anni
1.376
+9.447
-117.04%
1 gen 1996 anni
4.117
+2.742
199.31%
1 gen 1997 anni
4.902
+0.784
19.04%
1 gen 1998 anni
5.241
+0.34
6.93%
1 gen 1999 anni
6.293
+1.052
20.07%
1 gen 2000 anni
4.455
-1.838
-29.21%
1 gen 2001 anni
2.066
-2.39
-53.64%
1 gen 2002 anni
3.75
+1.684
81.54%
1 gen 2003 anni
5.194
+1.444
38.51%
1 gen 2004 anni
6.457
+1.263
24.32%
1 gen 2005 anni
5.103
-1.353
-20.96%
1 gen 2006 anni
1.903
-3.201
-62.72%
1 gen 2007 anni
4.789
+2.886
151.7%
1 gen 2008 anni
2.164
-2.625
-54.82%
1 gen 2009 anni
3.641
+1.477
68.25%
1 gen 2010 anni
3.247
-0.394
-10.82%
1 gen 2011 anni
2.6
-0.647
-19.93%
1 gen 2012 anni
4.116
+1.517
58.34%
1 gen 2013 anni
4.001
-0.115
-2.79%
1 gen 2014 anni
5.122
+1.121
28.01%
1 gen 2015 anni
7.228
+2.106
41.11%
1 gen 2016 anni
5.109
-2.119
-29.32%
Classificazione dei paesi secondo i statistiche attuali per anni


Commenti: