29
/it/
it
AIzaSyAYiBZKx7MnpbEhh9jyipgxe19OcubqV5w
April 1, 2024
96736
Burundi
BDI
true
2
1
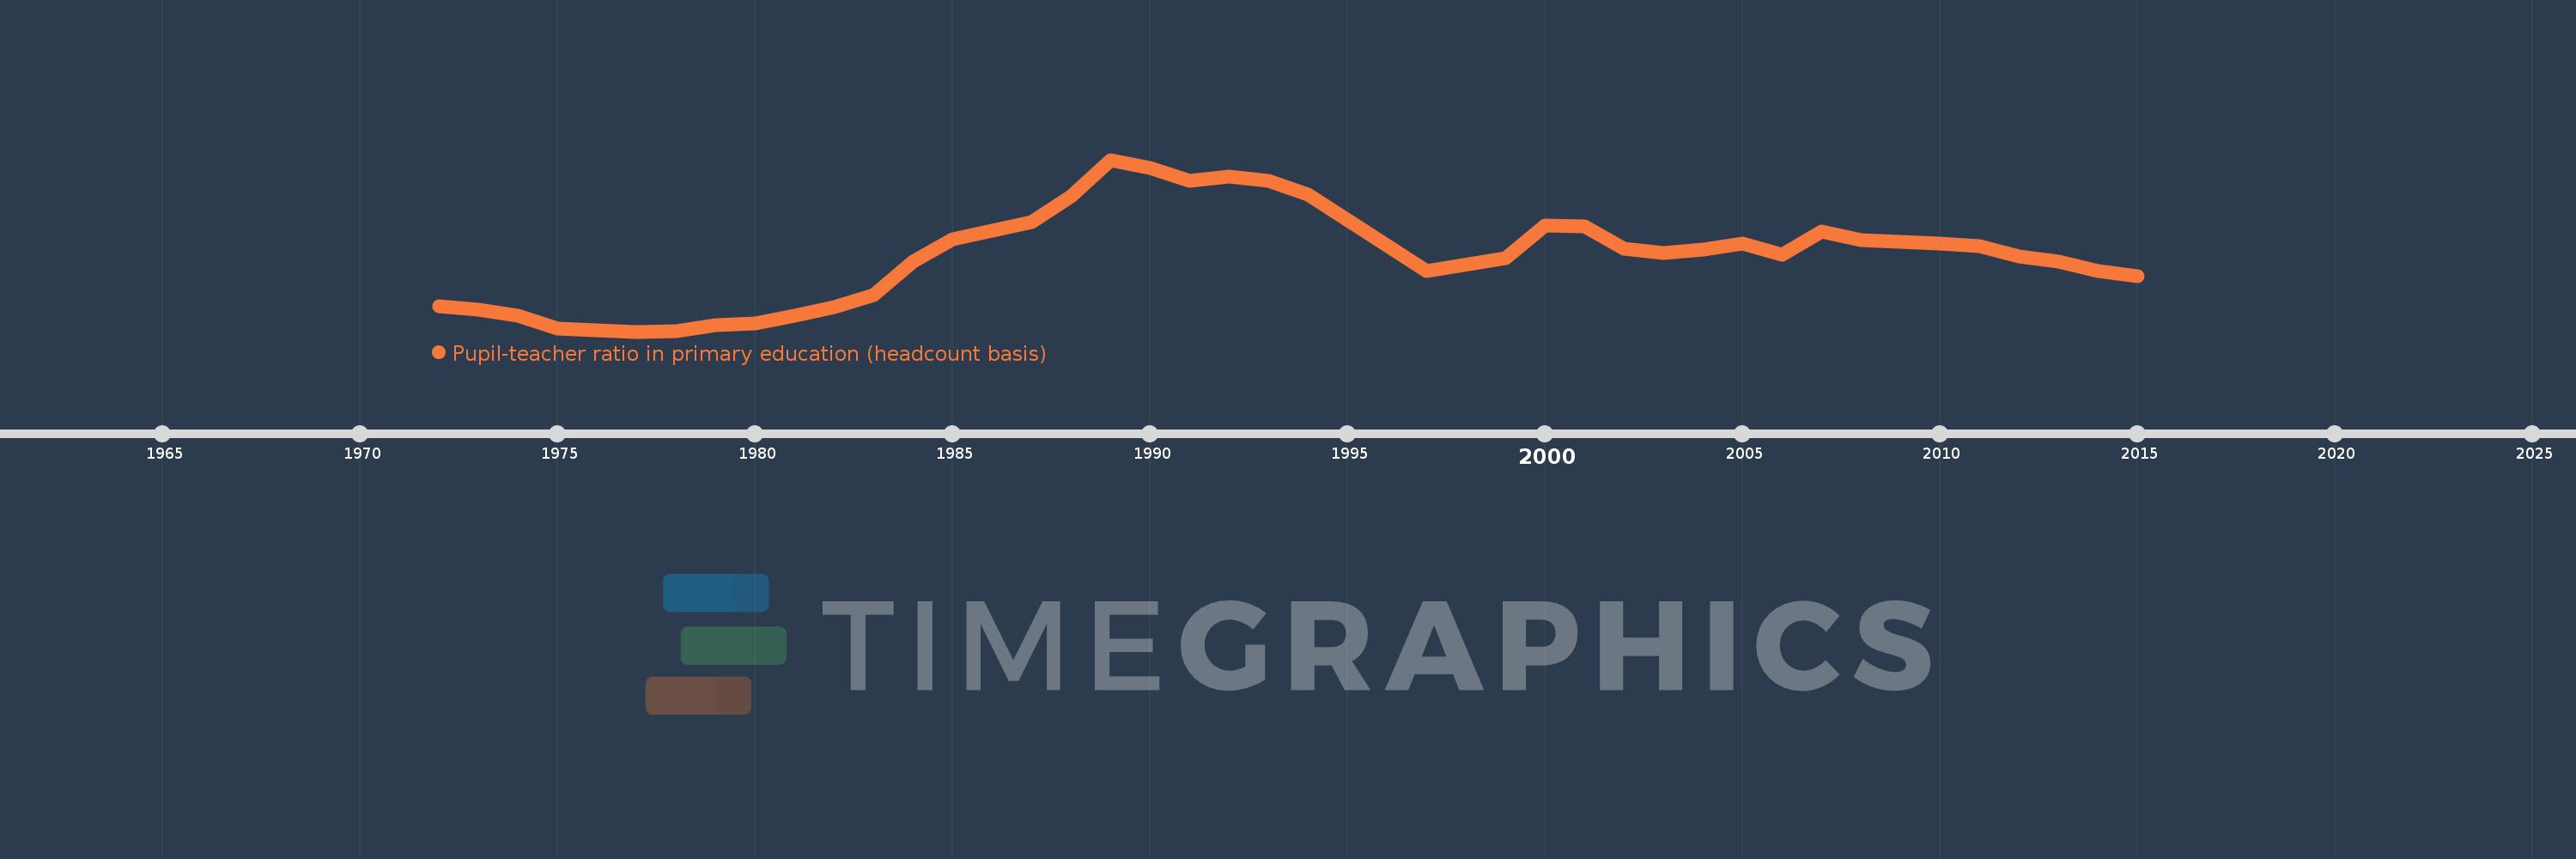
Pupil-teacher ratio in primary education (headcount basis)
2015,2014,2013,2012,2011,2010,2008,2007,2006,2005,2004,2003,2002,2001,2000,1999,1997,1994,1993,1992,1991,1990,1989,1988,1987,1986,1985,1984,1983,1982,1981,1980,1979,1978,1977,1976,1975,1974,1973,1972
Queste statistiche in altri paesi:
AfghanistanAlbaniaAlgeriaAndorraAngolaAntigua and BarbudaArab WorldArgentinaArmeniaArubaAustraliaAustriaAzerbaijanBahamas, TheBahrainBangladeshBarbadosBelarusBelgiumBelizeBeninBermudaBhutanBoliviaBosnia and HerzegovinaBotswanaBrazilBritish Virgin IslandsBrunei DarussalamBulgariaBurkina FasoBurundiCabo VerdeCambodiaCameroonCanadaCaribbean small statesCayman IslandsCentral African RepublicCentral Europe and the BalticsChadChileChinaColombiaComorosCongo, Dem. Rep.Congo, Rep.Costa RicaCote d'IvoireCroatiaCubaCyprusCzech RepublicDenmarkDjiboutiDominicaDominican RepublicEarly-demographic dividendEast Asia & PacificEast Asia & Pacific (excluding high income)East Asia & Pacific (IDA & IBRD countries)EcuadorEgypt, Arab Rep.El SalvadorEquatorial GuineaEritreaEstoniaEthiopiaEuro areaEurope & Central AsiaEurope & Central Asia (excluding high income)Europe & Central Asia (IDA & IBRD countries)European UnionFijiFinlandFragile and conflict affected situationsFranceGabonGambia, TheGeorgiaGermanyGhanaGibraltarGreeceGrenadaGuatemalaGuineaGuinea-BissauGuyanaHaitiHeavily indebted poor countries (HIPC)High incomeHondurasHong Kong SAR, ChinaHungaryIBRD onlyIcelandIDA & IBRD totalIDA blendIDA onlyIDA totalIndiaIndonesiaIran, Islamic Rep.IraqIrelandIsraelItalyJamaicaJapanJordanKazakhstanKenyaKiribatiKorea, Dem. People’s Rep.Korea, Rep.KuwaitKyrgyz RepublicLao PDRLate-demographic dividendLatin America & Caribbean Latin America & Caribbean (excluding high income)Latin America & the Caribbean (IDA & IBRD countries)LatviaLeast developed countries: UN classificationLebanonLesothoLiberiaLibyaLiechtensteinLithuaniaLow & middle incomeLow incomeLower middle incomeLuxembourgMacao SAR, ChinaMacedonia, FYRMadagascarMalawiMalaysiaMaldivesMaliMaltaMarshall IslandsMauritaniaMauritiusMexicoMicronesia, Fed. Sts.Middle East & North AfricaMiddle East & North Africa (excluding high income)Middle East & North Africa (IDA & IBRD countries)Middle incomeMoldovaMonacoMongoliaMoroccoMozambiqueMyanmarNamibiaNauruNepalNetherlandsNew ZealandNicaraguaNigerNigeriaNorth AmericaNorwayOECD membersOmanOther small statesPacific island small statesPakistanPalauPanamaPapua New GuineaParaguayPeruPhilippinesPolandPortugalPost-demographic dividendPre-demographic dividendPuerto RicoQatarRomaniaRussian FederationRwandaSamoaSan MarinoSao Tome and PrincipeSaudi ArabiaSenegalSerbiaSeychellesSierra LeoneSingaporeSint Maarten (Dutch part)Slovak RepublicSloveniaSmall statesSolomon IslandsSomaliaSouth AfricaSouth AsiaSouth Asia (IDA & IBRD)South SudanSpainSri LankaSt. Kitts and NevisSt. LuciaSt. Vincent and the GrenadinesSub-Saharan Africa Sub-Saharan Africa (excluding high income)Sub-Saharan Africa (IDA & IBRD countries)SudanSurinameSwazilandSwedenSwitzerlandSyrian Arab RepublicTajikistanTanzaniaThailandTimor-LesteTogoTongaTrinidad and TobagoTunisiaTurkeyTurks and Caicos IslandsTuvaluUgandaUkraineUnited Arab EmiratesUnited KingdomUnited StatesUpper middle incomeUruguayUzbekistanVanuatuVenezuela, RBVietnamWest Bank and GazaWorldYemen, Rep.ZambiaZimbabwe Linea del tempo:
Questa scala temporale mostra un grafico dal 1972 anno al 2015 anno. Burundi. I dati fino ad 1971 anno non disponibili. Il numero di osservazioni attuali secondo i date: 40.
La fonte (nome):
Indicatori dello sviluppo mondiale
La fonte (organizzazione):
UNESCO Institute for Statistics
Categorie:
Education
sono stati aggiornati
23 apr 2017 anni
Indicatori delle variazioni dei valori per anni
Minima:
30.864
1 gen 1977 anni
Massimo:
70.737
1 gen 1989 anni
Alla data di osservazione
Valore
Variazione assoluta
La variazione rispetto al valore precedente
1 gen 1972 anni
36.682
+36.682
0.0%
1 gen 1973 anni
36.001
-0.681
-1.86%
1 gen 1974 anni
34.641
-1.36
-3.78%
1 gen 1975 anni
31.508
-3.134
-9.05%
1 gen 1976 anni
31.142
-0.366
-1.16%
1 gen 1977 anni
30.864
-0.278
-0.89%
1 gen 1978 anni
30.939
+0.076
0.25%
1 gen 1979 anni
32.436
+1.497
4.84%
1 gen 1980 anni
32.797
+0.36
1.11%
1 gen 1981 anni
34.551
+1.754
5.35%
1 gen 1982 anni
36.599
+2.048
5.93%
1 gen 1983 anni
39.301
+2.702
7.38%
1 gen 1984 anni
47.078
+7.777
19.79%
1 gen 1985 anni
52.305
+5.228
11.1%
1 gen 1986 anni
54.259
+1.954
3.74%
1 gen 1987 anni
56.21
+1.95
3.59%
1 gen 1988 anni
62.352
+6.142
10.93%
1 gen 1989 anni
70.737
+8.386
13.45%
1 gen 1990 anni
68.906
-1.832
-2.59%
1 gen 1991 anni
65.873
-3.032
-4.4%
1 gen 1992 anni
66.899
+1.026
1.56%
1 gen 1993 anni
65.857
-1.043
-1.56%
1 gen 1994 anni
62.604
-3.252
-4.94%
1 gen 1997 anni
45.017
-17.588
-28.09%
1 gen 1999 anni
47.856
+2.839
6.31%
1 gen 2000 anni
55.413
+7.557
15.79%
1 gen 2001 anni
55.36
-0.053
-0.1%
1 gen 2002 anni
50.197
-5.163
-9.33%
1 gen 2003 anni
49.076
-1.121
-2.23%
1 gen 2004 anni
49.906
+0.829
1.69%
1 gen 2005 anni
51.245
+1.34
2.68%
1 gen 2006 anni
48.704
-2.541
-4.96%
1 gen 2007 anni
54.185
+5.481
11.25%
1 gen 2008 anni
51.998
-2.187
-4.04%
1 gen 2010 anni
51.361
-0.637
-1.23%
1 gen 2011 anni
50.602
-0.759
-1.48%
1 gen 2012 anni
48.311
-2.291
-4.53%
1 gen 2013 anni
47.105
-1.207
-2.5%
1 gen 2014 anni
45.0
-2.104
-4.47%
1 gen 2015 anni
43.654
-1.346
-2.99%
Classificazione dei paesi secondo i statistiche attuali per anni


Commenti: