29
/it/
it
AIzaSyAYiBZKx7MnpbEhh9jyipgxe19OcubqV5w
April 1, 2024
96182
Burundi
BDI
true
2
1
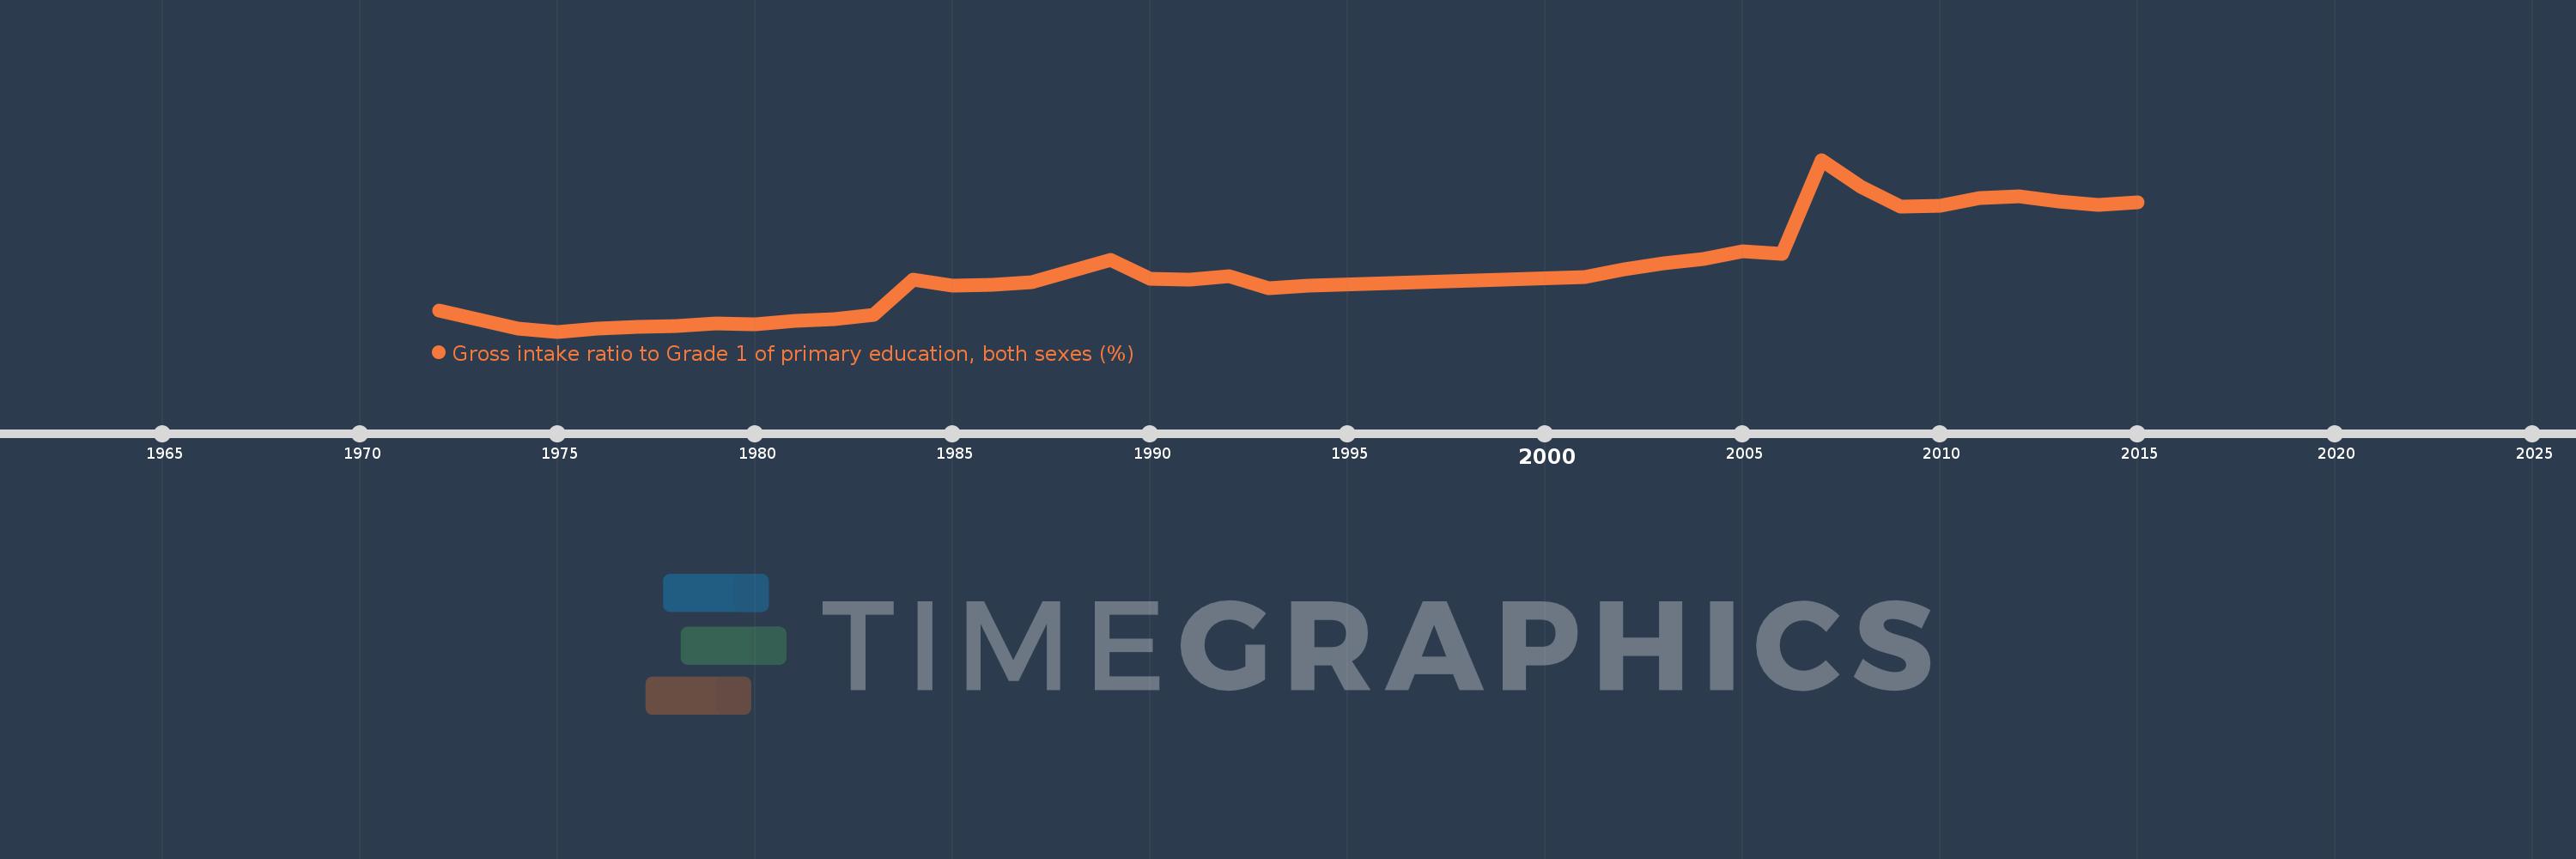
Gross intake ratio to Grade 1 of primary education, both sexes (%)
2015,2014,2013,2012,2011,2010,2009,2008,2007,2006,2005,2004,2003,2002,2001,1994,1993,1992,1991,1990,1989,1988,1987,1986,1985,1984,1983,1982,1981,1980,1979,1978,1977,1976,1975,1974,1972
Queste statistiche in altri paesi:
AfghanistanAlbaniaAlgeriaAngolaAntigua and BarbudaArab WorldArgentinaArmeniaArubaAustriaAzerbaijanBahamas, TheBahrainBangladeshBarbadosBelarusBelgiumBelizeBeninBermudaBhutanBoliviaBosnia and HerzegovinaBotswanaBrazilBritish Virgin IslandsBrunei DarussalamBulgariaBurkina FasoBurundiCabo VerdeCambodiaCameroonCanadaCaribbean small statesCentral African RepublicCentral Europe and the BalticsChadChileChinaColombiaComorosCongo, Dem. Rep.Congo, Rep.Costa RicaCote d'IvoireCroatiaCubaCyprusCzech RepublicDenmarkDjiboutiDominicaDominican RepublicEarly-demographic dividendEast Asia & PacificEast Asia & Pacific (excluding high income)East Asia & Pacific (IDA & IBRD countries)EcuadorEgypt, Arab Rep.El SalvadorEquatorial GuineaEritreaEstoniaEthiopiaEuro areaEurope & Central AsiaEurope & Central Asia (excluding high income)Europe & Central Asia (IDA & IBRD countries)European UnionFijiFinlandFragile and conflict affected situationsFranceGabonGambia, TheGeorgiaGermanyGhanaGreeceGrenadaGuatemalaGuineaGuinea-BissauGuyanaHaitiHeavily indebted poor countries (HIPC)High incomeHondurasHong Kong SAR, ChinaHungaryIBRD onlyIcelandIDA & IBRD totalIDA blendIDA onlyIDA totalIndiaIndonesiaIran, Islamic Rep.IraqIrelandIsraelItalyJamaicaJapanJordanKazakhstanKenyaKiribatiKorea, Dem. People’s Rep.Korea, Rep.KuwaitKyrgyz RepublicLao PDRLate-demographic dividendLatin America & Caribbean Latin America & Caribbean (excluding high income)Latin America & the Caribbean (IDA & IBRD countries)LatviaLeast developed countries: UN classificationLebanonLesothoLiberiaLibyaLiechtensteinLithuaniaLow & middle incomeLow incomeLower middle incomeLuxembourgMacao SAR, ChinaMacedonia, FYRMadagascarMalawiMalaysiaMaldivesMaliMaltaMarshall IslandsMauritaniaMauritiusMexicoMicronesia, Fed. Sts.Middle East & North AfricaMiddle East & North Africa (excluding high income)Middle East & North Africa (IDA & IBRD countries)Middle incomeMoldovaMongoliaMontenegroMoroccoMozambiqueMyanmarNamibiaNauruNepalNetherlandsNew ZealandNicaraguaNigerNigeriaNorth AmericaNorwayOECD membersOmanOther small statesPacific island small statesPakistanPalauPanamaPapua New GuineaParaguayPeruPhilippinesPolandPortugalPost-demographic dividendPre-demographic dividendPuerto RicoQatarRomaniaRussian FederationRwandaSamoaSan MarinoSao Tome and PrincipeSaudi ArabiaSenegalSerbiaSeychellesSierra LeoneSlovak RepublicSloveniaSmall statesSolomon IslandsSouth AfricaSouth AsiaSouth Asia (IDA & IBRD)South SudanSpainSri LankaSt. Kitts and NevisSt. LuciaSt. Vincent and the GrenadinesSub-Saharan Africa Sub-Saharan Africa (excluding high income)Sub-Saharan Africa (IDA & IBRD countries)SudanSurinameSwazilandSwedenSwitzerlandSyrian Arab RepublicTajikistanTanzaniaThailandTimor-LesteTogoTongaTrinidad and TobagoTunisiaTurkeyTuvaluUgandaUkraineUnited Arab EmiratesUnited StatesUpper middle incomeUruguayUzbekistanVanuatuVenezuela, RBVietnamWest Bank and GazaWorldYemen, Rep.ZambiaZimbabwe Linea del tempo:
Questa scala temporale mostra un grafico dal 1972 anno al 2015 anno. Burundi. I dati fino ad 1971 anno non disponibili. Il numero di osservazioni attuali secondo i date: 37.
La fonte (nome):
Indicatori dello sviluppo mondiale
La fonte (organizzazione):
UNESCO Institute for Statistics
Categorie:
Education
sono stati aggiornati
23 apr 2017 anni
Indicatori delle variazioni dei valori per anni
Minima:
18.001
1 gen 1975 anni
Massimo:
159.903
1 gen 2007 anni
Alla data di osservazione
Valore
Variazione assoluta
La variazione rispetto al valore precedente
1 gen 1972 anni
35.315
+35.315
0.0%
1 gen 1974 anni
20.177
-15.138
-42.87%
1 gen 1975 anni
18.001
-2.176
-10.78%
1 gen 1976 anni
20.405
+2.404
13.35%
1 gen 1977 anni
21.867
+1.463
7.17%
1 gen 1978 anni
22.967
+1.099
5.03%
1 gen 1979 anni
25.015
+2.049
8.92%
1 gen 1980 anni
23.814
-1.201
-4.8%
1 gen 1981 anni
26.896
+3.081
12.94%
1 gen 1982 anni
28.333
+1.437
5.34%
1 gen 1983 anni
31.651
+3.318
11.71%
1 gen 1984 anni
60.946
+29.295
92.56%
1 gen 1985 anni
55.852
-5.094
-8.36%
1 gen 1986 anni
56.78
+0.928
1.66%
1 gen 1987 anni
58.819
+2.039
3.59%
1 gen 1988 anni
67.793
+8.974
15.26%
1 gen 1989 anni
77.292
+9.498
14.01%
1 gen 1990 anni
61.865
-15.427
-19.96%
1 gen 1991 anni
61.276
-0.589
-0.95%
1 gen 1992 anni
63.529
+2.254
3.68%
1 gen 1993 anni
53.871
-9.659
-15.2%
1 gen 1994 anni
56.036
+2.166
4.02%
1 gen 2001 anni
63.205
+7.169
12.79%
1 gen 2002 anni
69.136
+5.931
9.38%
1 gen 2003 anni
74.263
+5.127
7.42%
1 gen 2004 anni
77.751
+3.488
4.7%
1 gen 2005 anni
84.375
+6.624
8.52%
1 gen 2006 anni
81.86
-2.516
-2.98%
1 gen 2007 anni
159.903
+78.043
95.34%
1 gen 2008 anni
137.203
-22.7
-14.2%
1 gen 2009 anni
120.882
-16.321
-11.9%
1 gen 2010 anni
122.182
+1.301
1.08%
1 gen 2011 anni
128.016
+5.834
4.77%
1 gen 2012 anni
129.498
+1.482
1.16%
1 gen 2013 anni
125.341
-4.157
-3.21%
1 gen 2014 anni
122.849
-2.492
-1.99%
1 gen 2015 anni
124.454
+1.605
1.31%
Classificazione dei paesi secondo i statistiche attuali per anni


Commenti: