29
/it/
it
AIzaSyAYiBZKx7MnpbEhh9jyipgxe19OcubqV5w
April 1, 2024
93442
Bulgaria
BGR
true
2
1
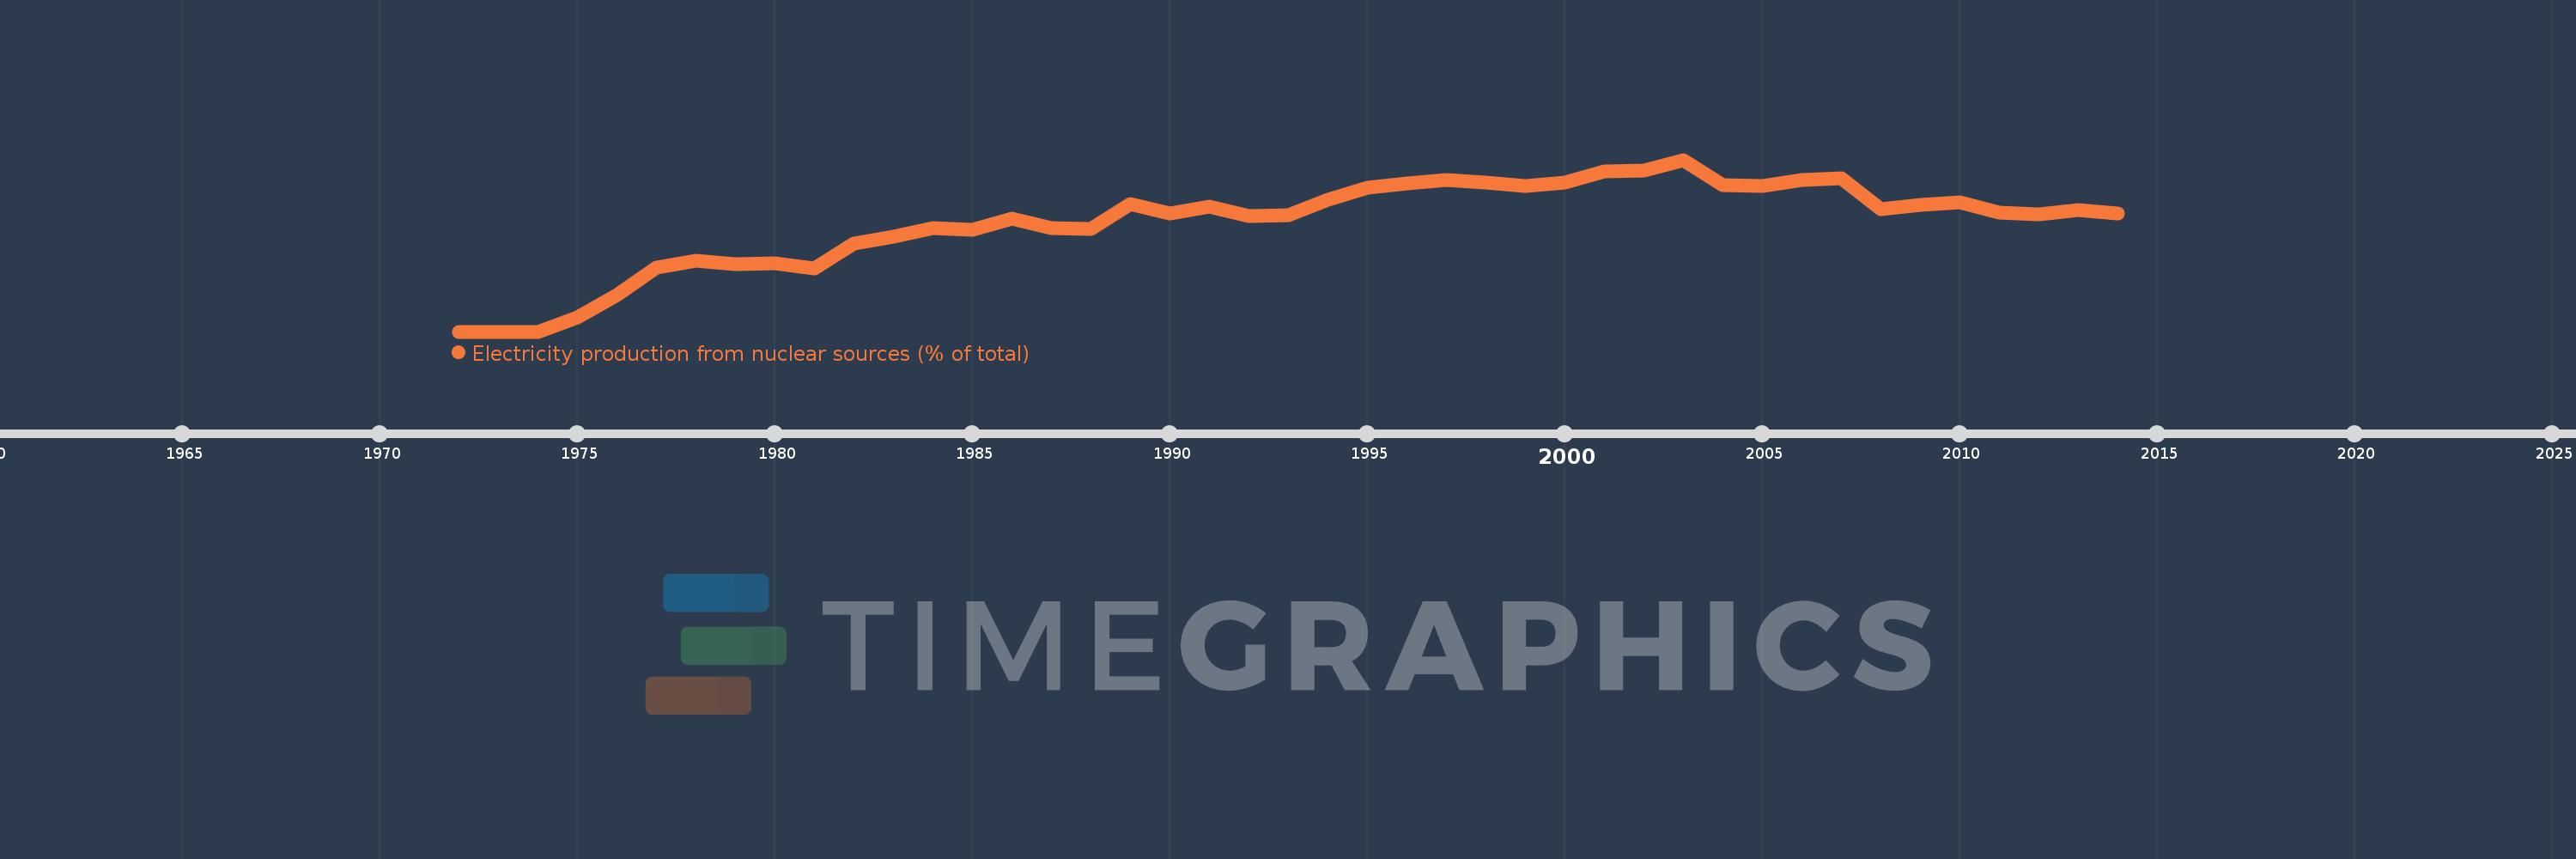
Electricity production from nuclear sources (% of total)
2014,2013,2012,2011,2010,2009,2008,2007,2006,2005,2004,2003,2002,2001,2000,1999,1998,1997,1996,1995,1994,1993,1992,1991,1990,1989,1988,1987,1986,1985,1984,1983,1982,1981,1980,1979,1978,1977,1976,1975,1974,1973,1972
Queste statistiche in altri paesi:
AlbaniaAlgeriaAngolaArab WorldArgentinaArmeniaAustraliaAustriaAzerbaijanBahrainBangladeshBelarusBelgiumBeninBoliviaBosnia and HerzegovinaBotswanaBrazilBrunei DarussalamBulgariaCambodiaCameroonCanadaCentral Europe and the BalticsChileChinaColombiaCongo, Dem. Rep.Congo, Rep.Costa RicaCote d'IvoireCroatiaCubaCuracaoCyprusCzech RepublicDenmarkDominican RepublicEarly-demographic dividendEast Asia & PacificEast Asia & Pacific (excluding high income)East Asia & Pacific (IDA & IBRD countries)EcuadorEgypt, Arab Rep.El SalvadorEritreaEstoniaEthiopiaEuro areaEurope & Central AsiaEurope & Central Asia (excluding high income)Europe & Central Asia (IDA & IBRD countries)European UnionFinlandFragile and conflict affected situationsFranceGabonGeorgiaGermanyGhanaGibraltarGreeceGuatemalaHaitiHeavily indebted poor countries (HIPC)High incomeHondurasHong Kong SAR, ChinaHungaryIBRD onlyIcelandIDA & IBRD totalIDA blendIDA onlyIDA totalIndiaIndonesiaIran, Islamic Rep.IraqIrelandIsraelItalyJamaicaJapanJordanKazakhstanKenyaKorea, Dem. People’s Rep.Korea, Rep.KosovoKuwaitKyrgyz RepublicLate-demographic dividendLatin America & Caribbean Latin America & Caribbean (excluding high income)Latin America & the Caribbean (IDA & IBRD countries)LatviaLeast developed countries: UN classificationLebanonLibyaLithuaniaLow & middle incomeLower middle incomeLuxembourgMacedonia, FYRMalaysiaMaltaMauritiusMexicoMiddle East & North AfricaMiddle East & North Africa (excluding high income)Middle East & North Africa (IDA & IBRD countries)Middle incomeMoldovaMongoliaMontenegroMoroccoMozambiqueMyanmarNamibiaNepalNetherlandsNew ZealandNicaraguaNigerNigeriaNorth AmericaNorwayOECD membersOmanOther small statesPakistanPanamaParaguayPeruPhilippinesPolandPortugalPost-demographic dividendPre-demographic dividendQatarRomaniaRussian FederationSaudi ArabiaSenegalSerbiaSingaporeSlovak RepublicSloveniaSmall statesSouth AfricaSouth AsiaSouth Asia (IDA & IBRD)South SudanSpainSri LankaSub-Saharan Africa Sub-Saharan Africa (excluding high income)Sub-Saharan Africa (IDA & IBRD countries)SudanSwedenSwitzerlandSyrian Arab RepublicTajikistanTanzaniaThailandTogoTrinidad and TobagoTunisiaTurkeyTurkmenistanUkraineUnited Arab EmiratesUnited KingdomUnited StatesUpper middle incomeUruguayUzbekistanVenezuela, RBVietnamWorldYemen, Rep.ZambiaZimbabwe Linea del tempo:
Questa scala temporale mostra un grafico dal 1972 anno al 2014 anno. Bulgaria. I dati fino ad 1971 anno non disponibili. Il numero di osservazioni attuali secondo i date: 43.
La fonte (nome):
Indicatori dello sviluppo mondiale
La fonte (organizzazione):
IEA Statistics © OECD/IEA 2014 (http://www.iea.org/stats/index.asp), subject to https://www.iea.org/t&c/termsandconditions/
Categorie:
Energy & Mining, Climate Change, Infrastructure
sono stati aggiornati
23 apr 2017 anni
Indicatori delle variazioni dei valori per anni
Minima:
0.0
1 gen 1972 anni
Massimo:
47.955
1 gen 2003 anni
Alla data di osservazione
Valore
Variazione assoluta
La variazione rispetto al valore precedente
1 gen 1972 anni
0.0
0.0
0.0%
1 gen 1975 anni
4.069
+4.069
%
1 gen 1976 anni
10.12
+6.051
148.7%
1 gen 1977 anni
17.98
+7.86
77.67%
1 gen 1978 anni
19.805
+1.824
10.15%
1 gen 1979 anni
18.767
-1.038
-5.24%
1 gen 1980 anni
19.093
+0.326
1.74%
1 gen 1981 anni
17.698
-1.395
-7.31%
1 gen 1982 anni
24.665
+6.967
39.37%
1 gen 1983 anni
26.56
+1.896
7.69%
1 gen 1984 anni
28.883
+2.323
8.75%
1 gen 1985 anni
28.508
-0.375
-1.3%
1 gen 1986 anni
31.541
+3.033
10.64%
1 gen 1987 anni
28.862
-2.679
-8.49%
1 gen 1988 anni
28.606
-0.256
-0.89%
1 gen 1989 anni
35.606
+6.999
24.47%
1 gen 1990 anni
32.86
-2.746
-7.71%
1 gen 1991 anni
34.8
+1.94
5.9%
1 gen 1992 anni
32.265
-2.535
-7.28%
1 gen 1993 anni
32.44
+0.176
0.54%
1 gen 1994 anni
36.774
+4.334
13.36%
1 gen 1995 anni
40.215
+3.441
9.36%
1 gen 1996 anni
41.305
+1.091
2.71%
1 gen 1997 anni
42.331
+1.026
2.48%
1 gen 1998 anni
41.648
-0.682
-1.61%
1 gen 1999 anni
40.737
-0.911
-2.19%
1 gen 2000 anni
41.595
+0.858
2.11%
1 gen 2001 anni
44.723
+3.128
7.52%
1 gen 2002 anni
44.914
+0.192
0.43%
1 gen 2003 anni
47.955
+3.04
6.77%
1 gen 2004 anni
40.824
-7.131
-14.87%
1 gen 2005 anni
40.59
-0.234
-0.57%
1 gen 2006 anni
42.42
+1.83
4.51%
1 gen 2007 anni
42.84
+0.42
0.99%
1 gen 2008 anni
34.103
-8.736
-20.39%
1 gen 2009 anni
35.36
+1.257
3.69%
1 gen 2010 anni
35.997
+0.637
1.8%
1 gen 2011 anni
33.138
-2.86
-7.94%
1 gen 2012 anni
32.613
-0.525
-1.58%
1 gen 2013 anni
33.889
+1.276
3.91%
1 gen 2014 anni
32.903
-0.986
-2.91%
Classificazione dei paesi secondo i statistiche attuali per anni


Commenti: