29
/it/
it
AIzaSyAYiBZKx7MnpbEhh9jyipgxe19OcubqV5w
April 1, 2024
92867
Brunei Darussalam
BRN
true
2
1
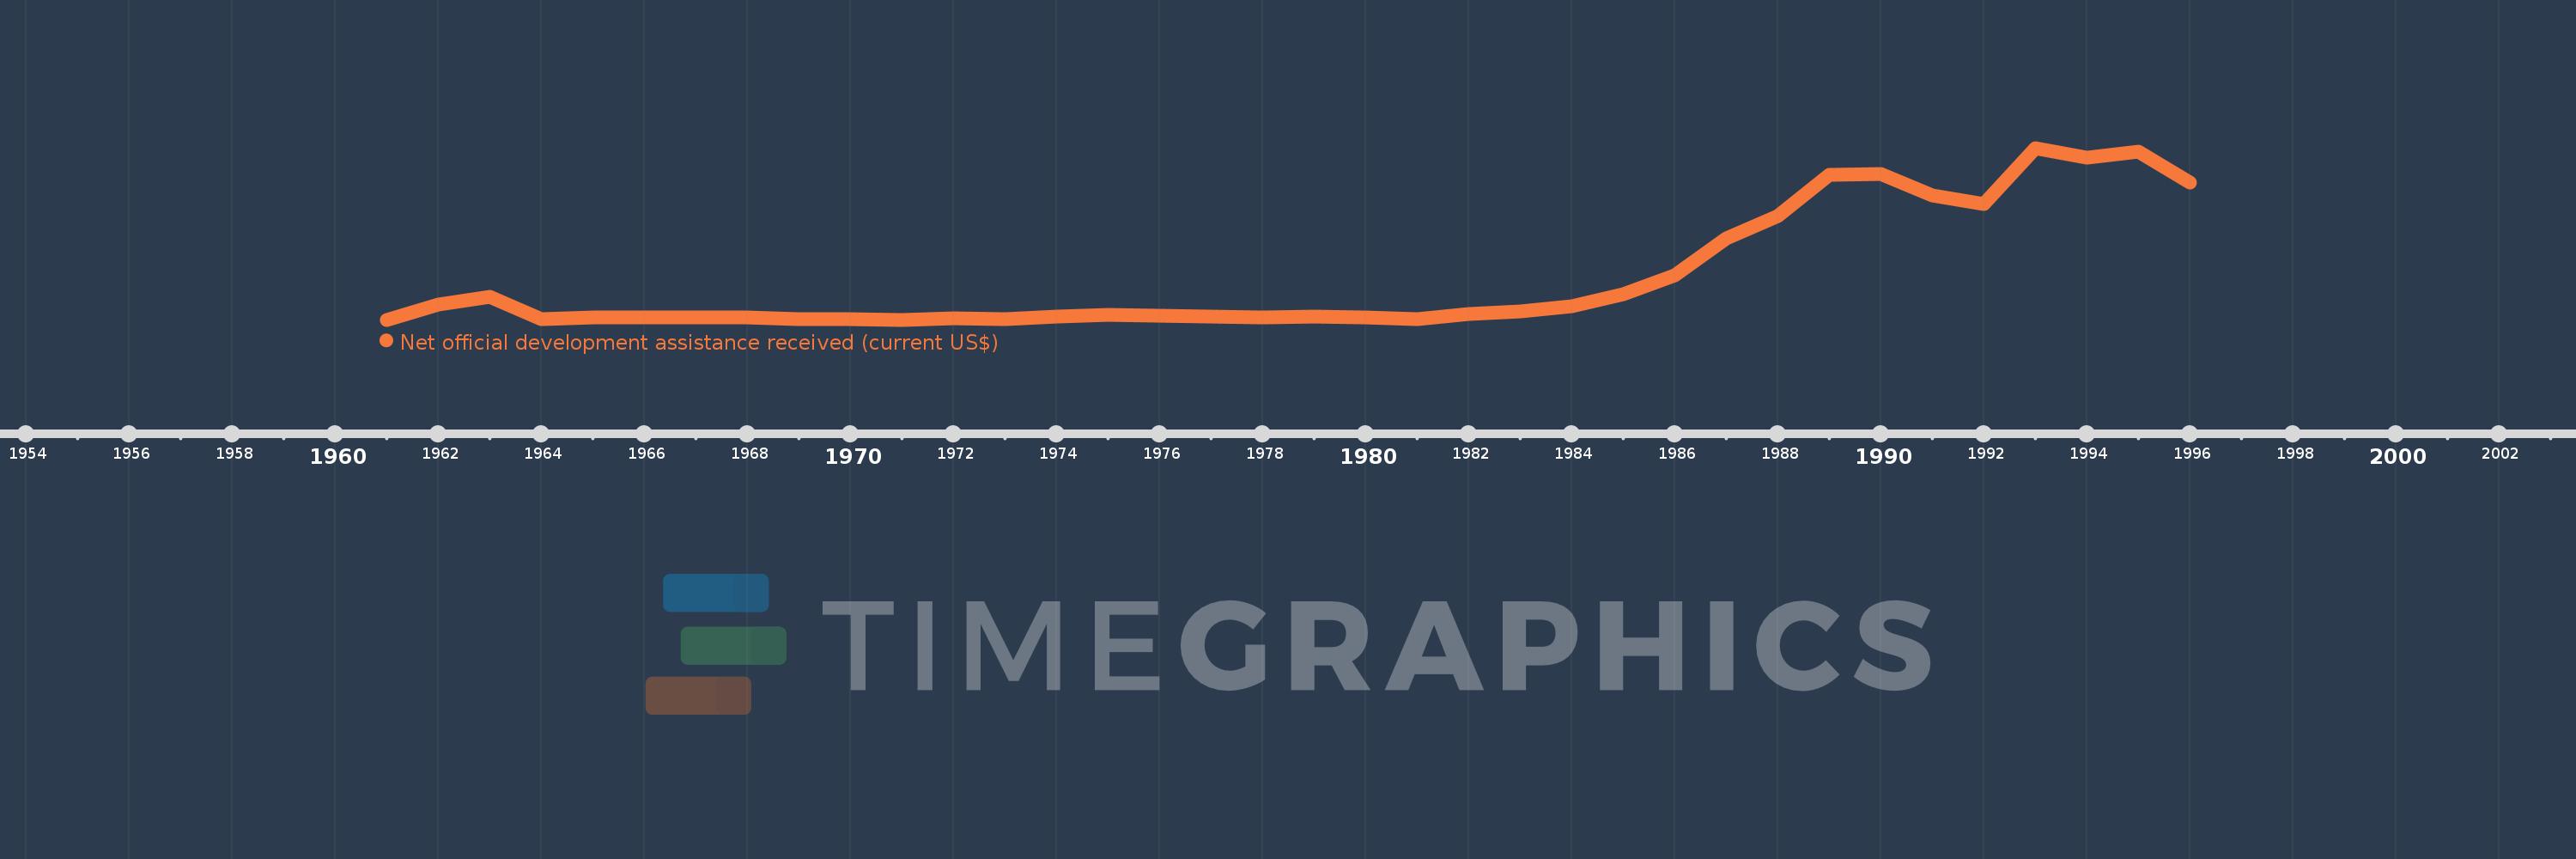
Net official development assistance received (current US$)
1996,1995,1994,1993,1992,1991,1990,1989,1988,1987,1986,1985,1984,1983,1982,1981,1980,1979,1978,1977,1976,1975,1974,1973,1972,1971,1970,1969,1968,1967,1966,1965,1964,1963,1962,1961
Queste statistiche in altri paesi:
AfghanistanAlbaniaAlgeriaAngolaAntigua and BarbudaArab WorldArgentinaArmeniaArubaAzerbaijanBahamas, TheBahrainBangladeshBarbadosBelarusBelizeBeninBermudaBhutanBoliviaBosnia and HerzegovinaBotswanaBrazilBritish Virgin IslandsBrunei DarussalamBurkina FasoBurundiCabo VerdeCambodiaCameroonCaribbean small statesCayman IslandsCentral African RepublicCentral Europe and the BalticsChadChileChinaColombiaComorosCongo, Dem. Rep.Congo, Rep.Costa RicaCote d'IvoireCroatiaCubaCyprusDjiboutiDominicaDominican RepublicEast Asia & PacificEast Asia & Pacific (excluding high income)East Asia & Pacific (IDA & IBRD countries)EcuadorEgypt, Arab Rep.El SalvadorEquatorial GuineaEritreaEthiopiaEuro areaEurope & Central AsiaEurope & Central Asia (excluding high income)Europe & Central Asia (IDA & IBRD countries)European UnionFijiFragile and conflict affected situationsFrench PolynesiaGabonGambia, TheGeorgiaGhanaGibraltarGrenadaGuatemalaGuineaGuinea-BissauGuyanaHaitiHeavily indebted poor countries (HIPC)High incomeHondurasHong Kong SAR, ChinaIBRD onlyIDA & IBRD totalIDA blendIDA onlyIDA totalIndiaIndonesiaIran, Islamic Rep.IraqIsraelJamaicaJordanKazakhstanKenyaKiribatiKorea, Dem. People’s Rep.Korea, Rep.KosovoKuwaitKyrgyz RepublicLao PDRLatin America & Caribbean Latin America & Caribbean (excluding high income)Latin America & the Caribbean (IDA & IBRD countries)Least developed countries: UN classificationLebanonLesothoLiberiaLibyaLow & middle incomeLow incomeLower middle incomeMacao SAR, ChinaMacedonia, FYRMadagascarMalawiMalaysiaMaldivesMaliMaltaMarshall IslandsMauritaniaMauritiusMexicoMicronesia, Fed. Sts.Middle East & North AfricaMiddle East & North Africa (excluding high income)Middle East & North Africa (IDA & IBRD countries)Middle incomeMoldovaMongoliaMontenegroMoroccoMozambiqueMyanmarNamibiaNauruNepalNew CaledoniaNicaraguaNigerNigeriaNorth AmericaNorthern Mariana IslandsOECD membersOmanOther small statesPacific island small statesPakistanPalauPanamaPapua New GuineaParaguayPeruPhilippinesQatarRwandaSamoaSao Tome and PrincipeSaudi ArabiaSenegalSerbiaSeychellesSierra LeoneSingaporeSloveniaSmall statesSolomon IslandsSomaliaSouth AfricaSouth AsiaSouth Asia (IDA & IBRD)South SudanSri LankaSt. Kitts and NevisSt. LuciaSt. Vincent and the GrenadinesSub-Saharan Africa Sub-Saharan Africa (excluding high income)Sub-Saharan Africa (IDA & IBRD countries)SudanSurinameSwazilandSyrian Arab RepublicTajikistanTanzaniaThailandTimor-LesteTogoTongaTrinidad and TobagoTunisiaTurkeyTurkmenistanTurks and Caicos IslandsTuvaluUgandaUkraineUnited Arab EmiratesUpper middle incomeUruguayUzbekistanVanuatuVenezuela, RBVietnamWest Bank and GazaWorldYemen, Rep.ZambiaZimbabwe Linea del tempo:
Questa scala temporale mostra un grafico dal 1961 anno al 1996 anno. Brunei Darussalam. I dati fino ad 1960 anno non disponibili. Il numero di osservazioni attuali secondo i date: 36.
La fonte (nome):
Indicatori dello sviluppo mondiale
La fonte (organizzazione):
Development Assistance Committee of the Organisation for Economic Co-operation and Development, Geographical Distribution of Financial Flows to Developing Countries, Development Co-operation Report, and International Development Statistics database. Data are available online at: www.oecd.org/dac/stats/idsonline.
Categorie:
Aid Effectiveness, Economy & Growth, External Debt
sono stati aggiornati
23 apr 2017 anni
Indicatori delle variazioni dei valori per anni
Minima:
10.0 Mille.
1 gen 1961 anni
Massimo:
5.37 Mln
1 gen 1993 anni
Alla data di osservazione
Valore
Variazione assoluta
La variazione rispetto al valore precedente
1 gen 1961 anni
10.0 Mille.
+10.0 Mille.
0.0%
1 gen 1962 anni
480.0 Mille.
+470.0 Mille.
4.7 Mille.%
1 gen 1963 anni
730.0 Mille.
+250.0 Mille.
52.08%
1 gen 1964 anni
40.0 Mille.
-690.0 Mille.
-94.52%
1 gen 1965 anni
70.0 Mille.
+30.0 Mille.
75.0%
1 gen 1966 anni
80.0 Mille.
+10.0 Mille.
14.29%
1 gen 1967 anni
80.0 Mille.
0.0
0.0%
1 gen 1968 anni
70.0 Mille.
-10.0 Mille.
-12.5%
1 gen 1969 anni
30.0 Mille.
-40.0 Mille.
-57.14%
1 gen 1970 anni
30.0 Mille.
0.0
0.0%
1 gen 1971 anni
10.0 Mille.
-20.0 Mille.
-66.67%
1 gen 1972 anni
50.0 Mille.
+40.0 Mille.
400.0%
1 gen 1973 anni
20.0 Mille.
-30.0 Mille.
-60.0%
1 gen 1974 anni
120.0 Mille.
+100.0 Mille.
500.0%
1 gen 1975 anni
150.0 Mille.
+30.0 Mille.
25.0%
1 gen 1976 anni
140.0 Mille.
-10.0 Mille.
-6.67%
1 gen 1977 anni
110.0 Mille.
-30.0 Mille.
-21.43%
1 gen 1978 anni
80.0 Mille.
-30.0 Mille.
-27.27%
1 gen 1979 anni
100.0 Mille.
+20.0 Mille.
25.0%
1 gen 1980 anni
90.0 Mille.
-10.0 Mille.
-10.0%
1 gen 1981 anni
30.0 Mille.
-60.0 Mille.
-66.67%
1 gen 1982 anni
190.0 Mille.
+160.0 Mille.
533.33%
1 gen 1983 anni
270.0 Mille.
+80.0 Mille.
42.11%
1 gen 1984 anni
440.0 Mille.
+170.0 Mille.
62.96%
1 gen 1985 anni
810.0 Mille.
+370.0 Mille.
84.09%
1 gen 1986 anni
1.4 Mln
+590.0 Mille.
72.84%
1 gen 1987 anni
2.54 Mln
+1.14 Mln
81.43%
1 gen 1988 anni
3.24 Mln
+700.0 Mille.
27.56%
1 gen 1989 anni
4.52 Mln
+1.28 Mln
39.51%
1 gen 1990 anni
4.56 Mln
+40.0 Mille.
0.88%
1 gen 1991 anni
3.88 Mln
-680.0 Mille.
-14.91%
1 gen 1992 anni
3.62 Mln
-260.0 Mille.
-6.7%
1 gen 1993 anni
5.37 Mln
+1.75 Mln
48.34%
1 gen 1994 anni
5.07 Mln
-300.0 Mille.
-5.59%
1 gen 1995 anni
5.26 Mln
+190.0 Mille.
3.75%
1 gen 1996 anni
4.29 Mln
-970.0 Mille.
-18.44%
Classificazione dei paesi secondo i statistiche attuali per anni


Commenti: