29
/it/
it
AIzaSyAYiBZKx7MnpbEhh9jyipgxe19OcubqV5w
April 1, 2024
85953
Bhutan
BTN
true
2
1
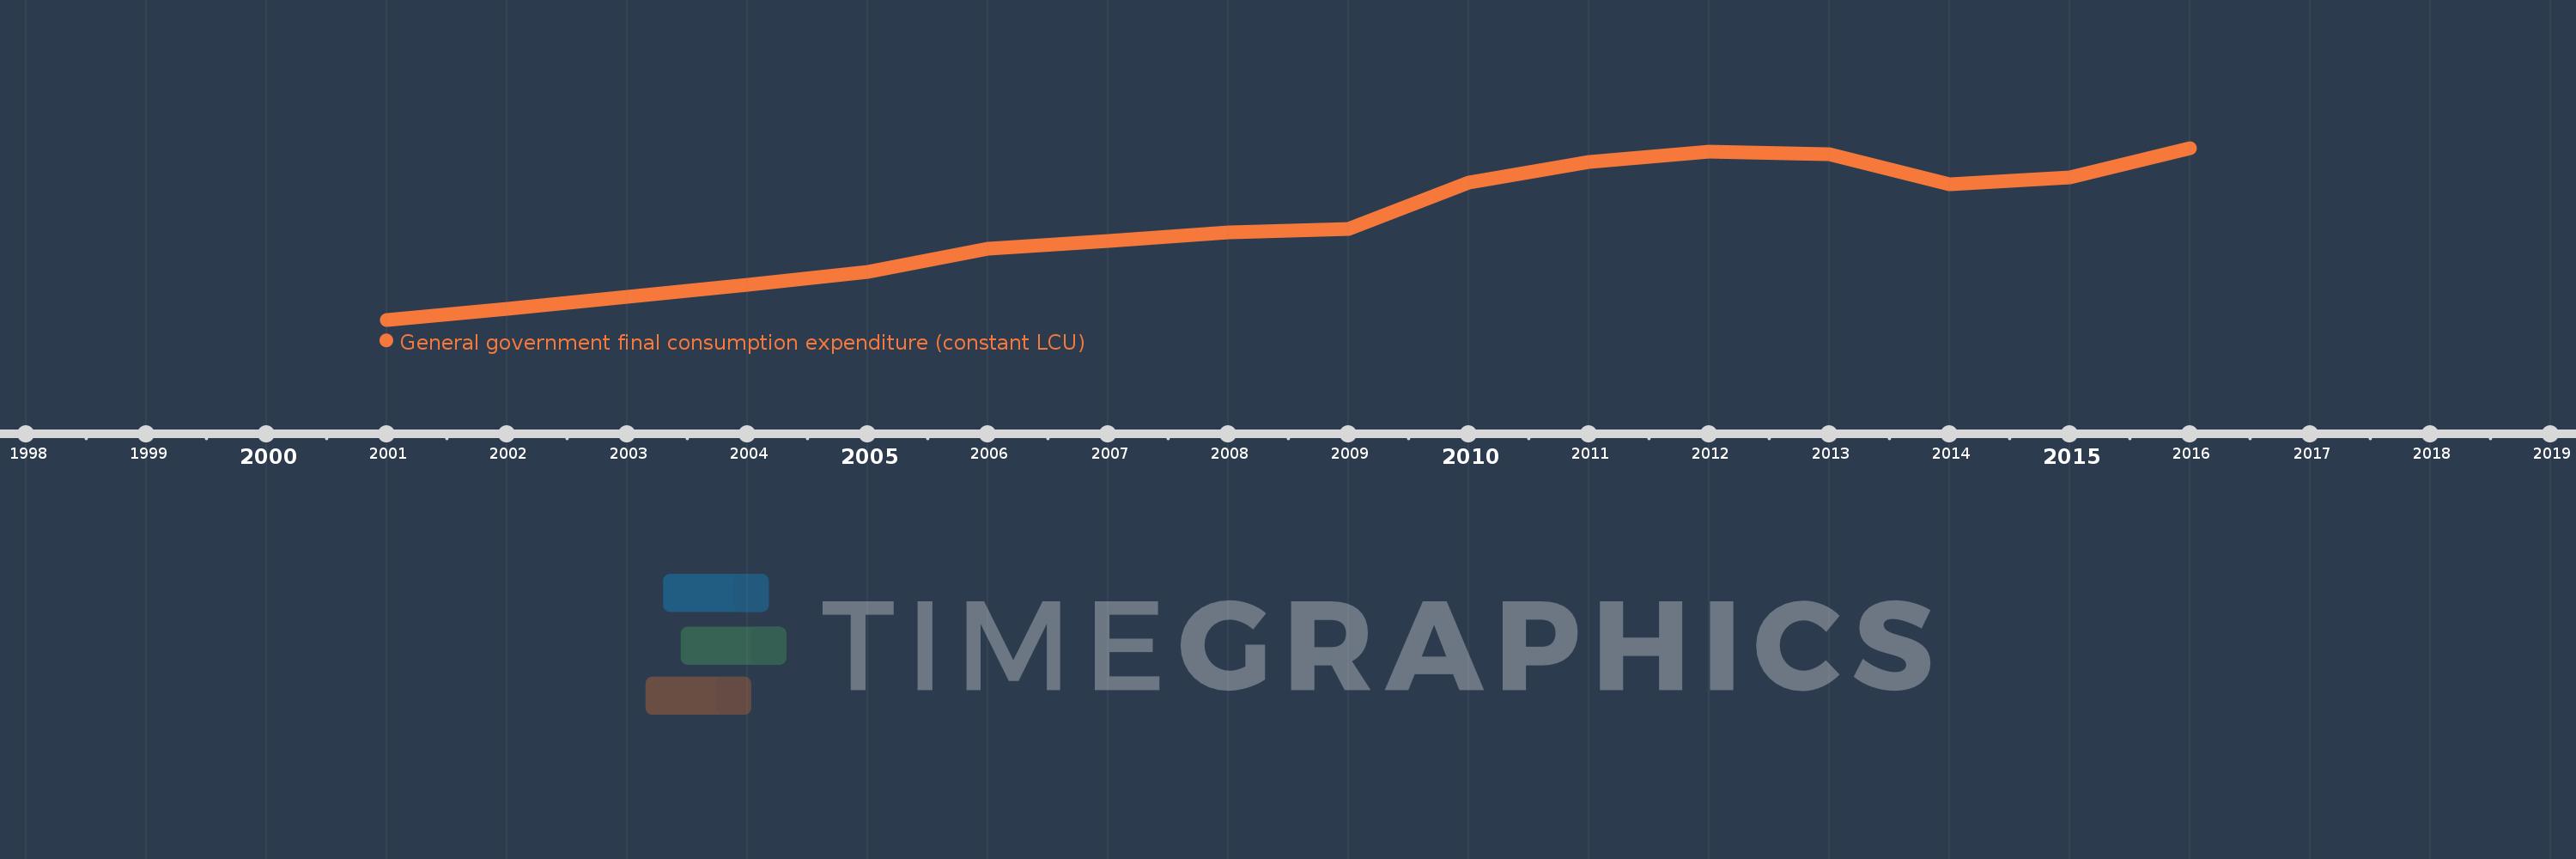
General government final consumption expenditure (constant LCU)
2016,2015,2014,2013,2012,2011,2010,2009,2008,2007,2006,2005,2004,2003,2002,2001
Queste statistiche in altri paesi:
AlbaniaAlgeriaAngolaAntigua and BarbudaArgentinaArmeniaAustraliaAustriaAzerbaijanBahamas, TheBahrainBangladeshBarbadosBelarusBelgiumBelizeBeninBhutanBoliviaBosnia and HerzegovinaBotswanaBrazilBrunei DarussalamBulgariaBurkina FasoBurundiCabo VerdeCambodiaCameroonCanadaChadChileChinaColombiaComorosCongo, Dem. Rep.Congo, Rep.Costa RicaCote d'IvoireCroatiaCubaCyprusCzech RepublicDenmarkDjiboutiDominican RepublicEcuadorEgypt, Arab Rep.El SalvadorEquatorial GuineaEritreaEstoniaEthiopiaFijiFinlandFranceGabonGambia, TheGeorgiaGermanyGhanaGreeceGuatemalaGuineaGuinea-BissauHaitiHondurasHong Kong SAR, ChinaHungaryIcelandIndiaIndonesiaIran, Islamic Rep.IrelandIsraelItalyJamaicaJapanJordanKazakhstanKenyaKorea, Rep.KosovoKuwaitKyrgyz RepublicLao PDRLatviaLebanonLiberiaLithuaniaLuxembourgMacao SAR, ChinaMacedonia, FYRMadagascarMalawiMalaysiaMaliMaltaMauritaniaMauritiusMexicoMoldovaMongoliaMontenegroMoroccoMozambiqueNamibiaNepalNetherlandsNew ZealandNicaraguaNigerNigeriaNorwayOmanPakistanPanamaPapua New GuineaParaguayPeruPhilippinesPolandPortugalPuerto RicoQatarRomaniaRussian FederationRwandaSaudi ArabiaSenegalSerbiaSeychellesSierra LeoneSingaporeSlovak RepublicSloveniaSomaliaSouth AfricaSouth SudanSpainSri LankaSudanSurinameSwazilandSwedenSwitzerlandSyrian Arab RepublicTajikistanTanzaniaThailandTimor-LesteTogoTrinidad and TobagoTunisiaTurkeyTurkmenistanUgandaUkraineUnited Arab EmiratesUnited KingdomUnited StatesUruguayVanuatuVenezuela, RBVietnamWest Bank and GazaZambiaZimbabwe Linea del tempo:
Questa scala temporale mostra un grafico dal 2001 anno al 2016 anno. Bhutan. I dati fino ad 2000 anno non disponibili. Il numero di osservazioni attuali secondo i date: 16.
La fonte (nome):
Indicatori dello sviluppo mondiale
La fonte (organizzazione):
World Bank national accounts data, and OECD National Accounts data files.
Categorie:
Economy & Growth
sono stati aggiornati
23 apr 2017 anni
Indicatori delle variazioni dei valori per anni
Minima:
4.331 Mlrd
1 gen 2001 anni
Massimo:
9.914 Mlrd
1 gen 2016 anni
Alla data di osservazione
Valore
Variazione assoluta
La variazione rispetto al valore precedente
1 gen 2001 anni
4.331 Mlrd
+4.331 Mlrd
0.0%
1 gen 2002 anni
4.681 Mlrd
+350.51 Mln
8.09%
1 gen 2003 anni
5.087 Mlrd
+405.264 Mln
8.66%
1 gen 2004 anni
5.472 Mlrd
+384.94 Mln
7.57%
1 gen 2005 anni
5.877 Mlrd
+405.082 Mln
7.4%
1 gen 2006 anni
6.639 Mlrd
+761.805 Mln
12.96%
1 gen 2007 anni
6.898 Mlrd
+259.709 Mln
3.91%
1 gen 2008 anni
7.176 Mlrd
+278.017 Mln
4.03%
1 gen 2009 anni
7.277 Mlrd
+101.203 Mln
1.41%
1 gen 2010 anni
8.795 Mlrd
+1.518 Mlrd
20.85%
1 gen 2011 anni
9.459 Mlrd
+664.0 Mln
7.55%
1 gen 2012 anni
9.798 Mlrd
+339.0 Mln
3.58%
1 gen 2013 anni
9.724 Mlrd
-74.0 Mln
-0.76%
1 gen 2014 anni
8.741 Mlrd
-983.0 Mln
-10.11%
1 gen 2015 anni
8.948 Mlrd
+206.76 Mln
2.37%
1 gen 2016 anni
9.914 Mlrd
+966.48 Mln
10.8%
Classificazione dei paesi secondo i statistiche attuali per anni


Commenti: