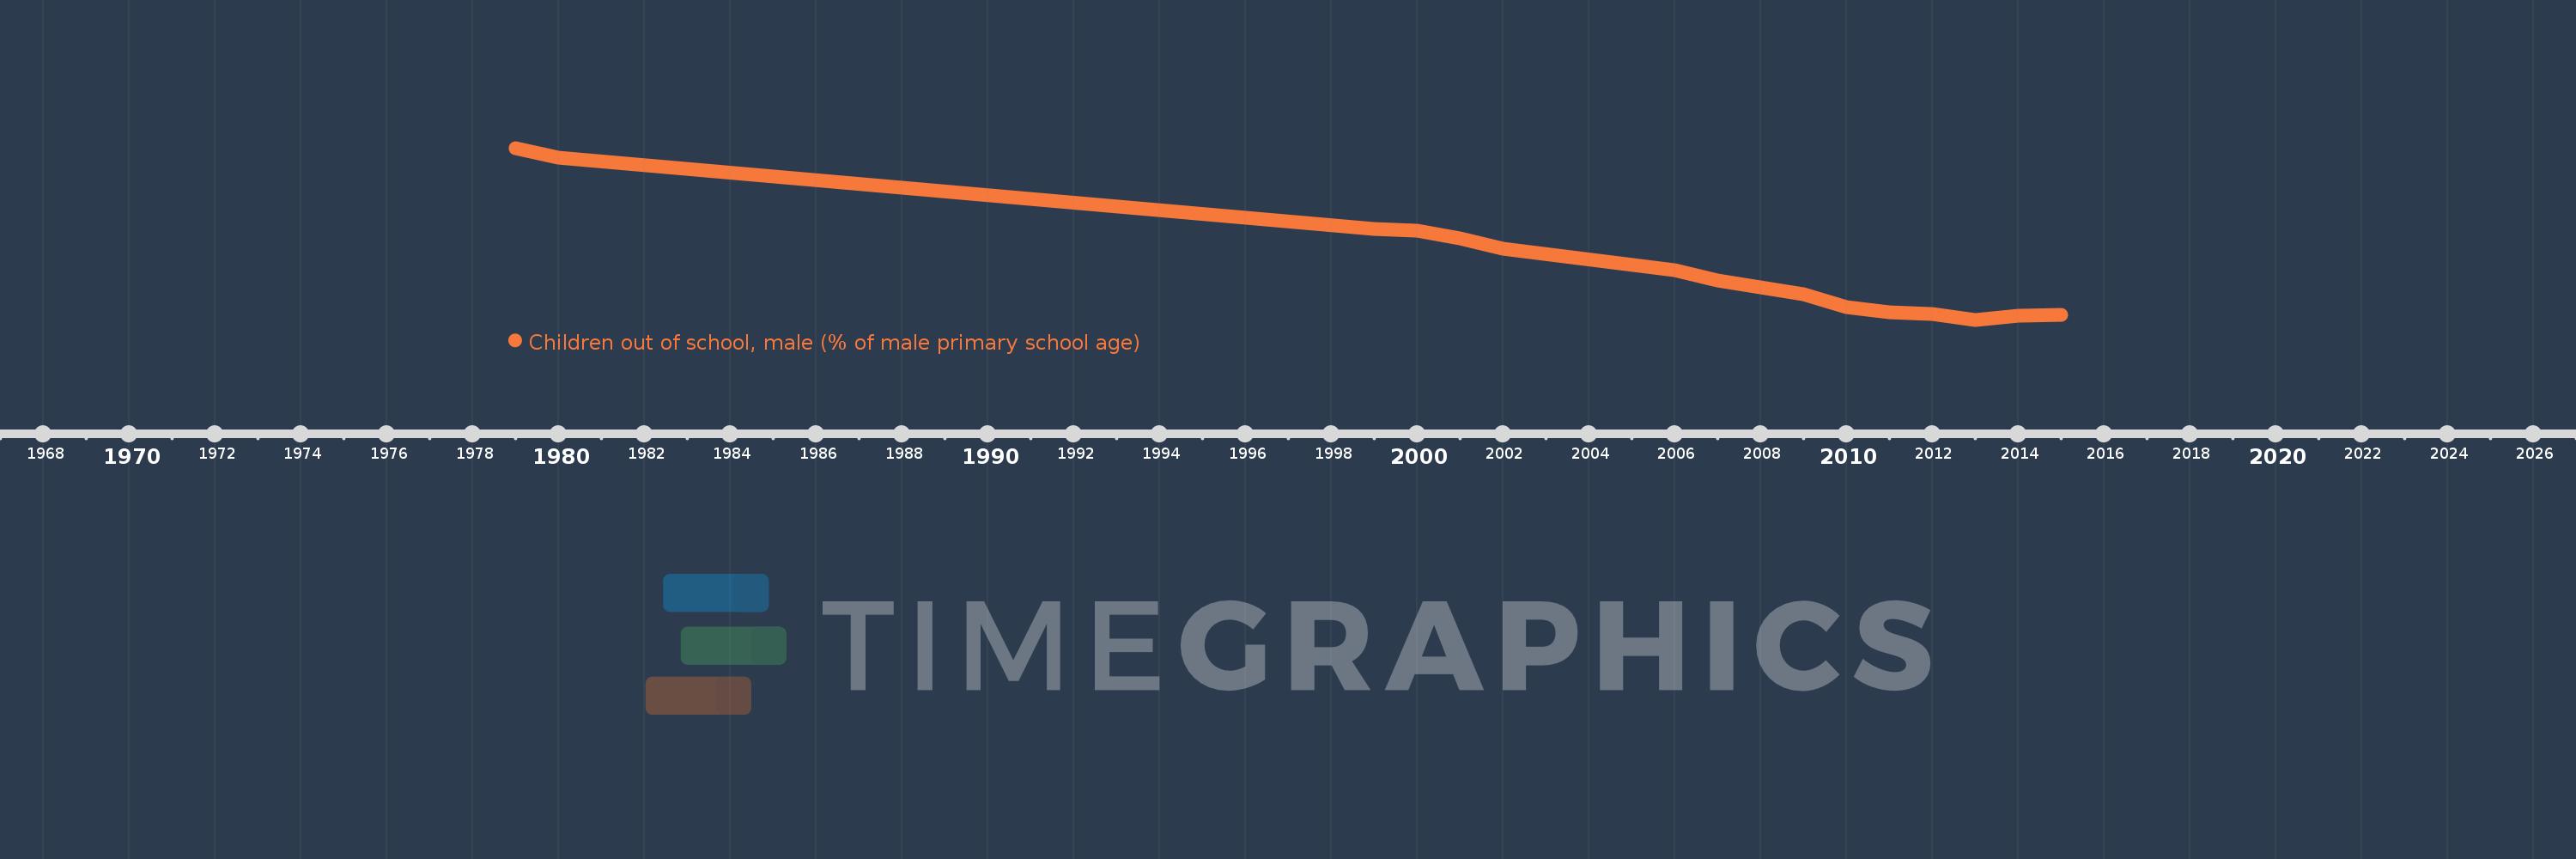
Questa scala temporale mostra un grafico dal 1979 anno al 2015 anno. Bhutan. I dati fino ad 1978 anno non disponibili. Il numero di osservazioni attuali secondo i date: 15.
La fonte (nome):
Indicatori dello sviluppo mondiale
La fonte (organizzazione):
United Nations Educational, Scientific, and Cultural Organization (UNESCO) Institute for Statistics.
Categorie:
Education
sono stati aggiornati
23 apr 2017 anni
Indicatori delle variazioni dei valori per anni
In media:
28.837
Minima:
10.654
1 gen 2013 anni
Massimo:
68.178
1 gen 1979 anni
Alla data di osservazione
Valore
Variazione assoluta
La variazione rispetto al valore precedente
1 gen 1979 anni
68.178
+68.178
0.0%
1 gen 1980 anni
64.953
-3.225
-4.73%
1 gen 1999 anni
41.115
-23.838
-36.7%
1 gen 2000 anni
40.385
-0.73
-1.78%
1 gen 2001 anni
37.909
-2.476
-6.13%
1 gen 2002 anni
34.487
-3.422
-9.03%
1 gen 2006 anni
27.194
-7.294
-21.15%
1 gen 2007 anni
23.773
-3.421
-12.58%
1 gen 2009 anni
19.124
-4.649
-19.55%
1 gen 2010 anni
14.875
-4.249
-22.22%
1 gen 2011 anni
13.145
-1.73
-11.63%
1 gen 2012 anni
12.448
-0.697
-5.3%
1 gen 2013 anni
10.654
-1.794
-14.41%
1 gen 2014 anni
12.06
+1.406
13.19%
1 gen 2015 anni
12.258
+0.198
1.64%
Classificazione dei paesi secondo i statistiche attuali per anni
