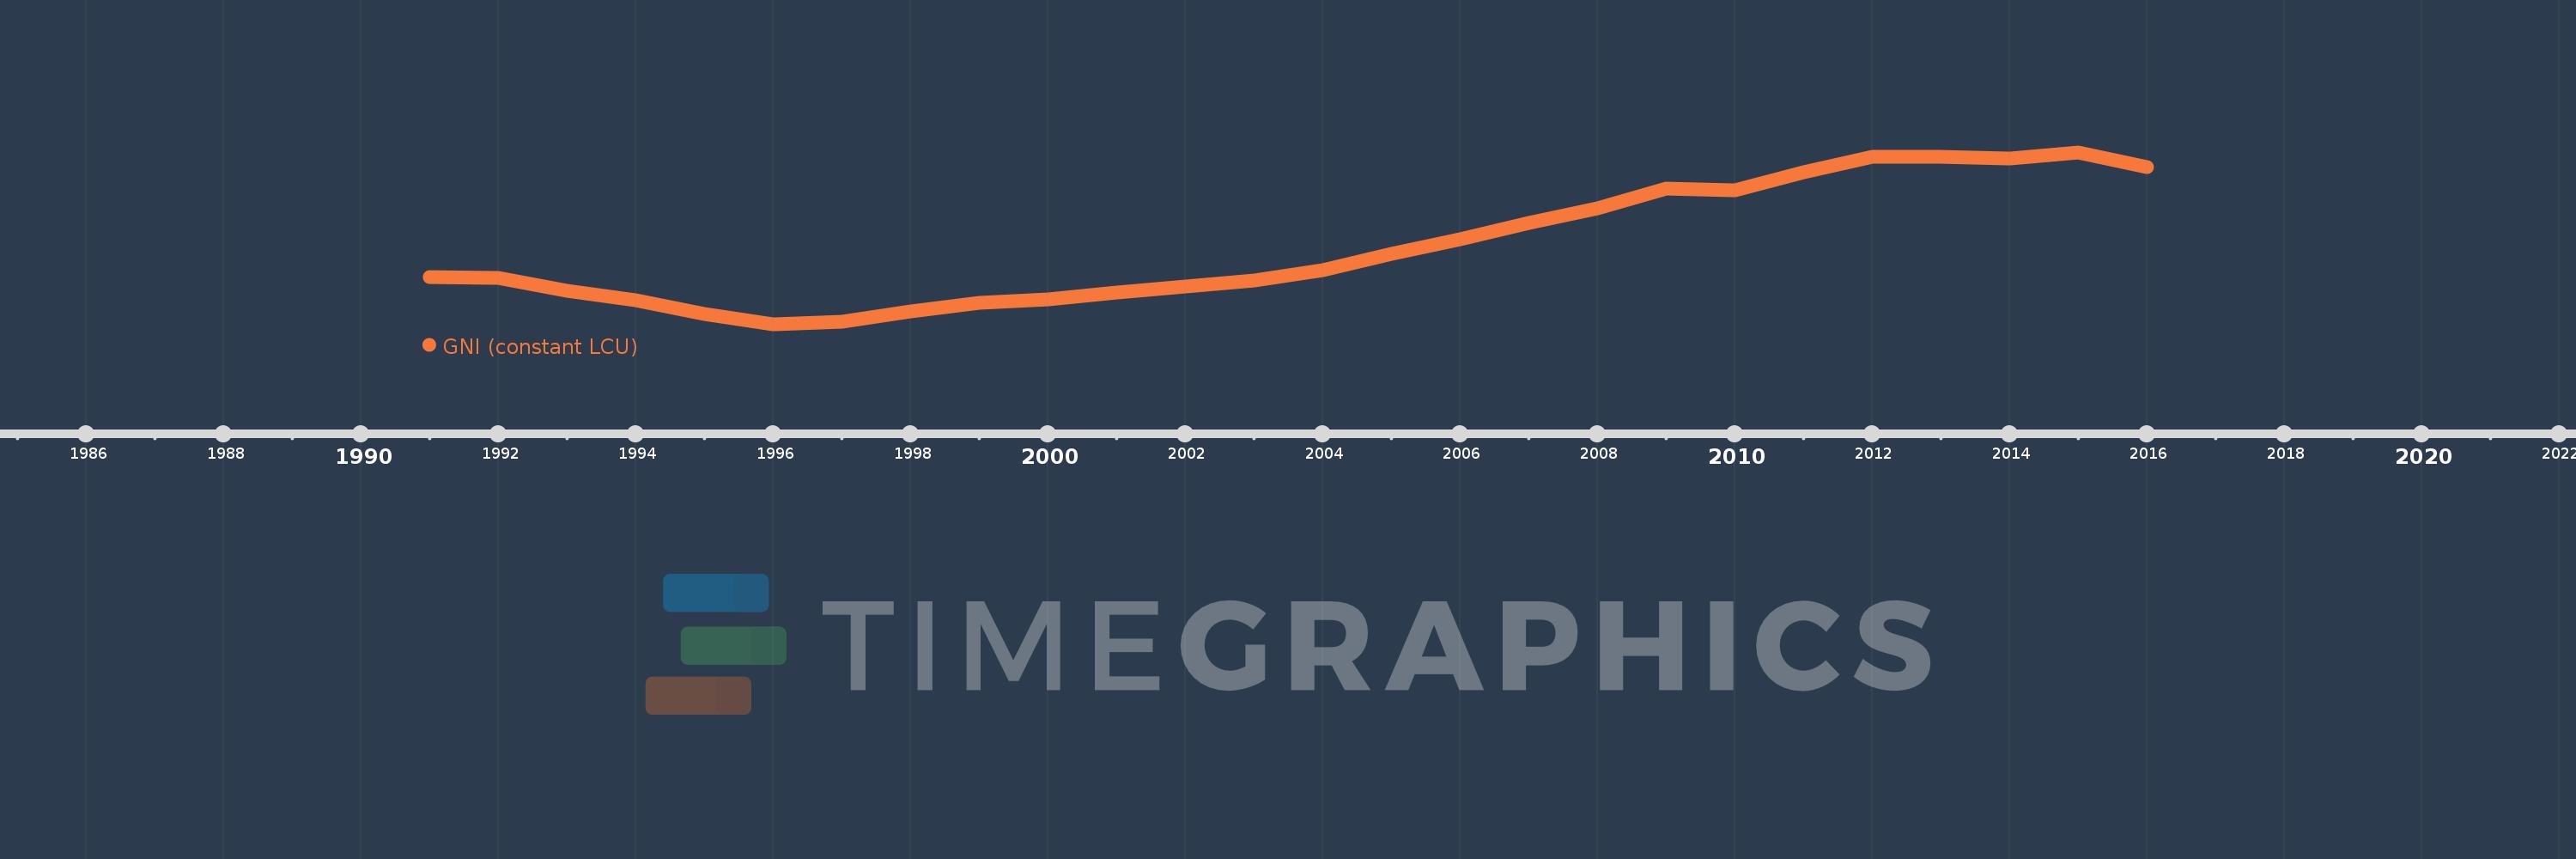
Questa scala temporale mostra un grafico dal 1991 anno al 2016 anno. Belarus. I dati fino ad 1990 anno non disponibili. Il numero di osservazioni attuali secondo i date: 26.
La fonte (nome):
Indicatori dello sviluppo mondiale
La fonte (organizzazione):
World Bank national accounts data, and OECD National Accounts data files.
Categorie:
Economy & Growth
sono stati aggiornati
23 apr 2017 anni
Indicatori delle variazioni dei valori per anni
In media:
12.56 Trln
Minima:
6.701 Trln
1 gen 1996 anni
Massimo:
19.706 Trln
1 gen 2015 anni
Alla data di osservazione
Valore
Variazione assoluta
La variazione rispetto al valore precedente
1 gen 1991 anni
10.301 Trln
+10.301 Trln
0.0%
1 gen 1992 anni
10.177 Trln
-123.61 Mlrd
-1.2%
1 gen 1993 anni
9.2 Trln
-977.012 Mlrd
-9.6%
1 gen 1994 anni
8.505 Trln
-695.067 Mlrd
-7.55%
1 gen 1995 anni
7.492 Trln
-1.013 Trln
-11.92%
1 gen 1996 anni
6.701 Trln
-790.536 Mlrd
-10.55%
1 gen 1997 anni
6.899 Trln
+198.13 Mlrd
2.96%
1 gen 1998 anni
7.657 Trln
+757.859 Mlrd
10.98%
1 gen 1999 anni
8.297 Trln
+639.98 Mlrd
8.36%
1 gen 2000 anni
8.603 Trln
+305.973 Mlrd
3.69%
1 gen 2001 anni
9.1 Trln
+497.135 Mlrd
5.78%
1 gen 2002 anni
9.526 Trln
+425.852 Mlrd
4.68%
1 gen 2003 anni
10.028 Trln
+502.019 Mlrd
5.27%
1 gen 2004 anni
10.772 Trln
+743.434 Mlrd
7.41%
1 gen 2005 anni
12.001 Trln
+1.23 Trln
11.42%
1 gen 2006 anni
13.141 Trln
+1.14 Trln
9.5%
1 gen 2007 anni
14.373 Trln
+1.232 Trln
9.37%
1 gen 2008 anni
15.501 Trln
+1.129 Trln
7.85%
1 gen 2009 anni
16.988 Trln
+1.487 Trln
9.59%
1 gen 2010 anni
16.845 Trln
-143.119 Mlrd
-0.84%
1 gen 2011 anni
18.181 Trln
+1.336 Trln
7.93%
1 gen 2012 anni
19.381 Trln
+1.2 Trln
6.6%
1 gen 2013 anni
19.368 Trln
-13.261 Mlrd
-0.07%
1 gen 2014 anni
19.242 Trln
-125.914 Mlrd
-0.65%
1 gen 2015 anni
19.706 Trln
+464.069 Mlrd
2.41%
1 gen 2016 anni
18.571 Trln
-1.136 Trln
-5.76%
Classificazione dei paesi secondo i statistiche attuali per anni
