29
/it/
it
AIzaSyAYiBZKx7MnpbEhh9jyipgxe19OcubqV5w
April 1, 2024
77471
Bahrain
BHR
true
2
1
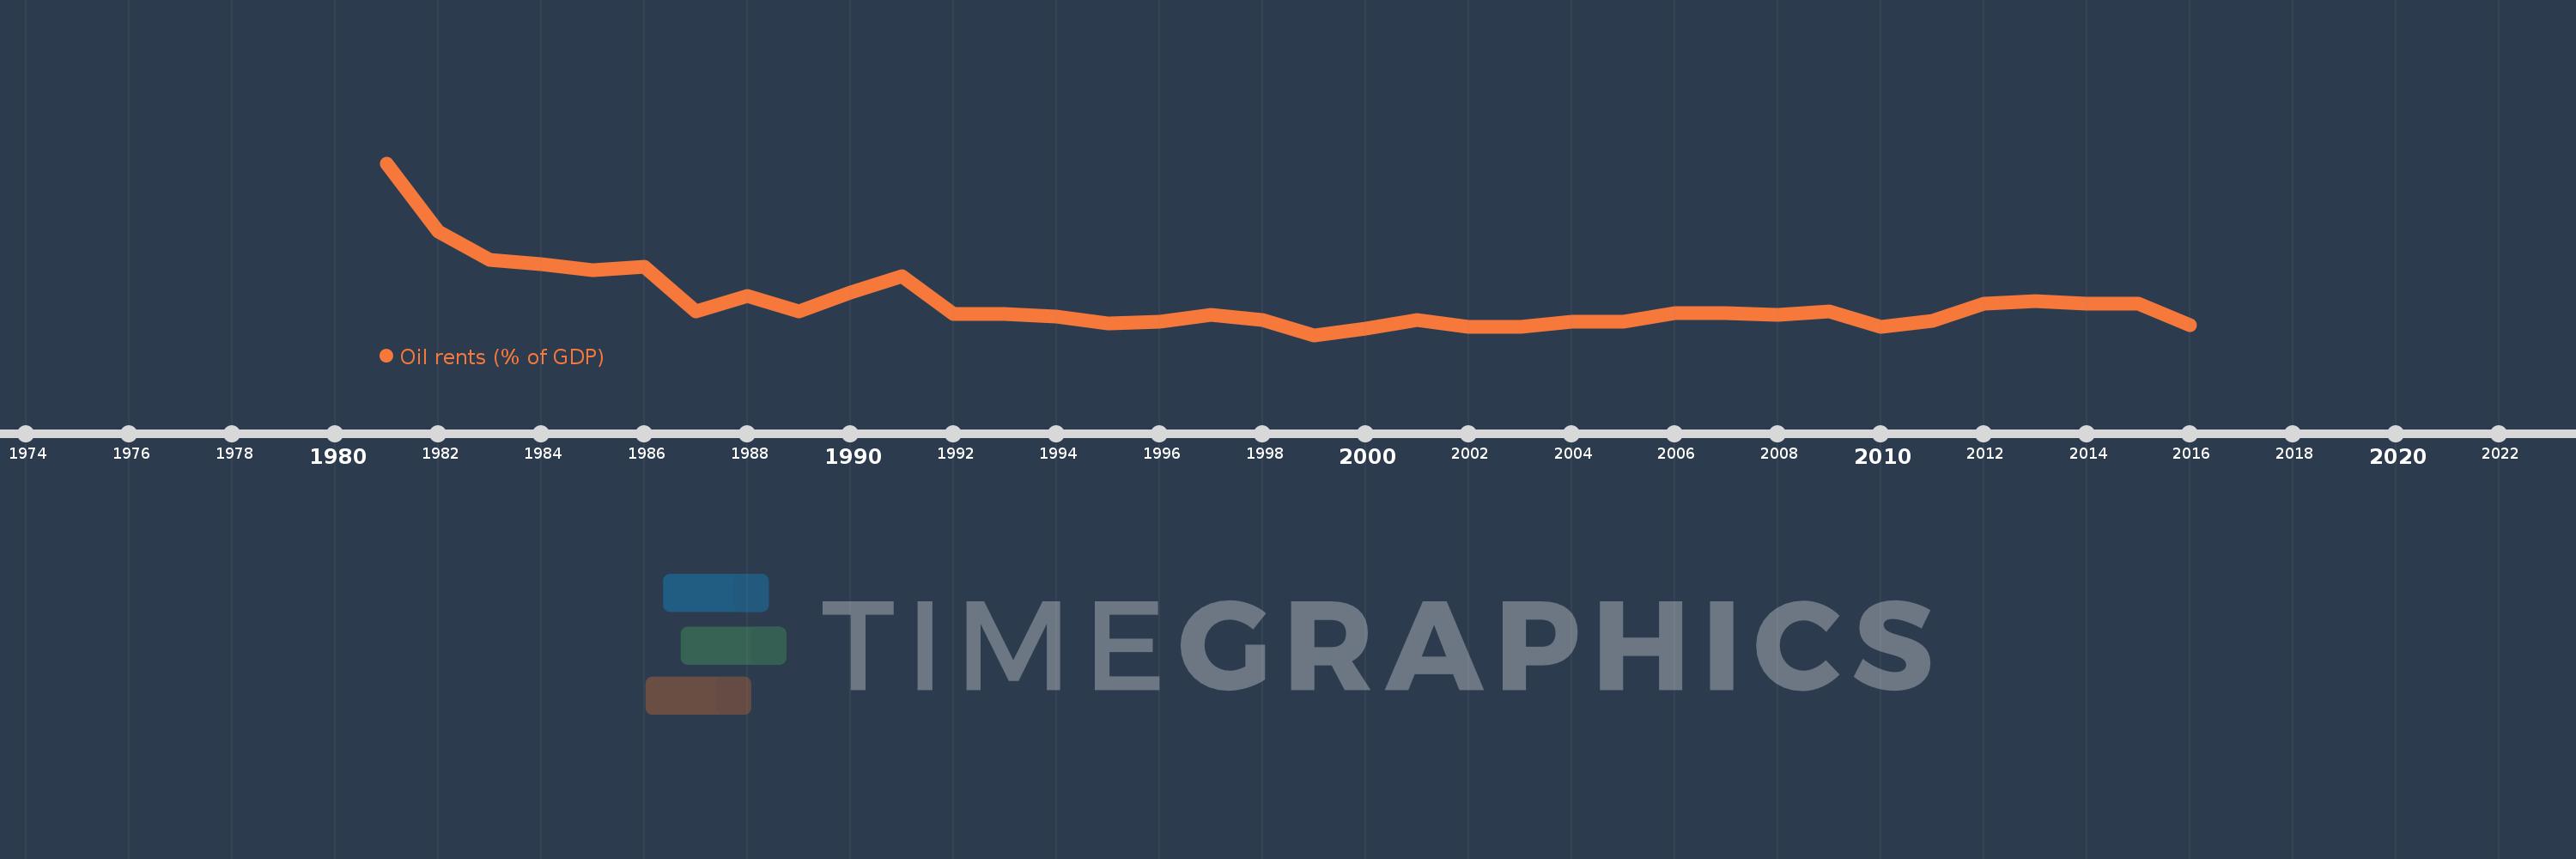
Oil rents (% of GDP)
2016,2015,2014,2013,2012,2011,2010,2009,2008,2007,2006,2005,2004,2003,2002,2001,2000,1999,1998,1997,1996,1995,1994,1993,1992,1991,1990,1989,1988,1987,1986,1985,1984,1983,1982,1981
Queste statistiche in altri paesi:
Linea del tempo:
Questa scala temporale mostra un grafico dal 1981 anno al 2016 anno. Bahrain. I dati fino ad 1980 anno non disponibili. Il numero di osservazioni attuali secondo i date: 36.
La fonte (nome):
Indicatori dello sviluppo mondiale
La fonte (organizzazione):
Estimates based on sources and methods described in "The Changing Wealth of Nations: Measuring Sustainable Development in the New Millennium" (World Bank, 2011).
Categorie:
Energy & Mining, Environment
sono stati aggiornati
23 apr 2017 anni
Indicatori delle variazioni dei valori per anni
Minima:
1.699
1 gen 1999 anni
Massimo:
17.097
1 gen 1981 anni
Alla data di osservazione
Valore
Variazione assoluta
La variazione rispetto al valore precedente
1 gen 1981 anni
17.097
+17.097
0.0%
1 gen 1982 anni
10.98
-6.117
-35.78%
1 gen 1983 anni
8.411
-2.569
-23.4%
1 gen 1984 anni
8.035
-0.376
-4.47%
1 gen 1985 anni
7.549
-0.486
-6.05%
1 gen 1986 anni
7.858
+0.309
4.09%
1 gen 1987 anni
3.833
-4.025
-51.22%
1 gen 1988 anni
5.191
+1.358
35.42%
1 gen 1989 anni
3.803
-1.387
-26.73%
1 gen 1990 anni
5.52
+1.717
45.15%
1 gen 1991 anni
6.935
+1.415
25.63%
1 gen 1992 anni
3.593
-3.343
-48.2%
1 gen 1993 anni
3.569
-0.024
-0.67%
1 gen 1994 anni
3.351
-0.218
-6.1%
1 gen 1995 anni
2.771
-0.58
-17.3%
1 gen 1996 anni
2.901
+0.13
4.68%
1 gen 1997 anni
3.536
+0.635
21.91%
1 gen 1998 anni
3.014
-0.522
-14.77%
1 gen 1999 anni
1.699
-1.315
-43.64%
1 gen 2000 anni
2.288
+0.59
34.72%
1 gen 2001 anni
3.043
+0.755
32.99%
1 gen 2002 anni
2.451
-0.592
-19.45%
1 gen 2003 anni
2.451
0.0
-0.01%
1 gen 2004 anni
2.854
+0.403
16.46%
1 gen 2005 anni
2.927
+0.073
2.54%
1 gen 2006 anni
3.625
+0.698
23.83%
1 gen 2007 anni
3.68
+0.055
1.53%
1 gen 2008 anni
3.476
-0.204
-5.54%
1 gen 2009 anni
3.813
+0.337
9.69%
1 gen 2010 anni
2.418
-1.395
-36.58%
1 gen 2011 anni
2.971
+0.553
22.85%
1 gen 2012 anni
4.547
+1.576
53.06%
1 gen 2013 anni
4.778
+0.231
5.07%
1 gen 2014 anni
4.521
-0.257
-5.38%
1 gen 2015 anni
4.475
-0.046
-1.03%
1 gen 2016 anni
2.559
-1.916
-42.82%
Classificazione dei paesi secondo i statistiche attuali per anni


Commenti: