29
/it/
it
AIzaSyAYiBZKx7MnpbEhh9jyipgxe19OcubqV5w
April 1, 2024
73758
Austria
AUT
true
2
1
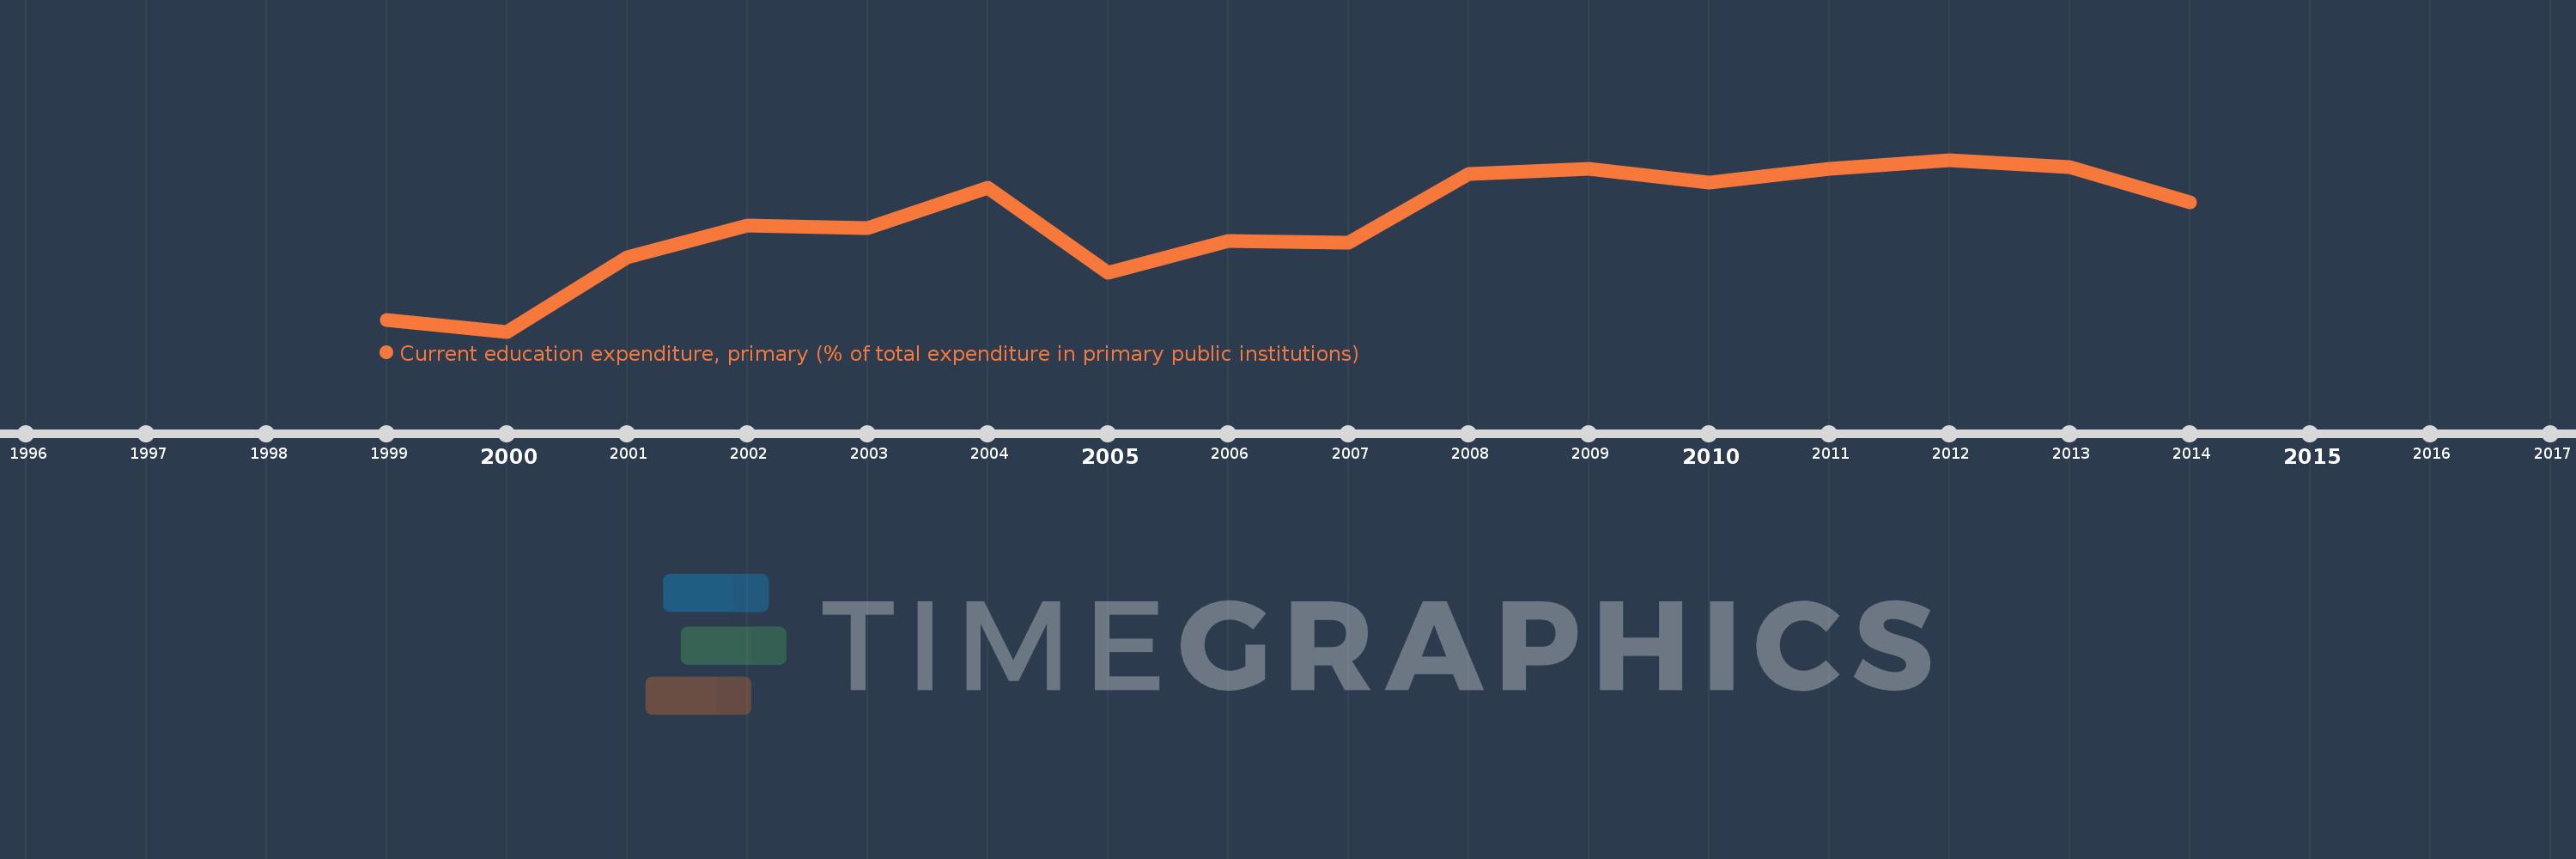
Current education expenditure, primary (% of total expenditure in primary public institutions)
2014,2013,2012,2011,2010,2009,2008,2007,2006,2005,2004,2003,2002,2001,2000,1999
Queste statistiche in altri paesi:
Linea del tempo:
Questa scala temporale mostra un grafico dal 1999 anno al 2014 anno. Austria. I dati fino ad 1998 anno non disponibili. Il numero di osservazioni attuali secondo i date: 16.
La fonte (nome):
Indicatori dello sviluppo mondiale
La fonte (organizzazione):
United Nations Educational, Scientific, and Cultural Organization (UNESCO) Institute for Statistics.
Categorie:
Education
sono stati aggiornati
23 apr 2017 anni
Indicatori delle variazioni dei valori per anni
Minima:
92.078
1 gen 2000 anni
Massimo:
98.021
1 gen 2012 anni
Alla data di osservazione
Valore
Variazione assoluta
La variazione rispetto al valore precedente
1 gen 1999 anni
92.465
+92.465
0.0%
1 gen 2000 anni
92.078
-0.386
-0.42%
1 gen 2001 anni
94.637
+2.559
2.78%
1 gen 2002 anni
95.745
+1.108
1.17%
1 gen 2003 anni
95.649
-0.096
-0.1%
1 gen 2004 anni
97.044
+1.395
1.46%
1 gen 2005 anni
94.128
-2.915
-3.0%
1 gen 2006 anni
95.227
+1.099
1.17%
1 gen 2007 anni
95.157
-0.07
-0.07%
1 gen 2008 anni
97.53
+2.373
2.49%
1 gen 2009 anni
97.695
+0.165
0.17%
1 gen 2010 anni
97.226
-0.469
-0.48%
1 gen 2011 anni
97.717
+0.49
0.5%
1 gen 2012 anni
98.021
+0.305
0.31%
1 gen 2013 anni
97.768
-0.254
-0.26%
1 gen 2014 anni
96.559
-1.208
-1.24%
Classificazione dei paesi secondo i statistiche attuali per anni


Commenti: