29
/it/
it
AIzaSyAYiBZKx7MnpbEhh9jyipgxe19OcubqV5w
April 1, 2024
72790
Australia
AUS
true
2
1
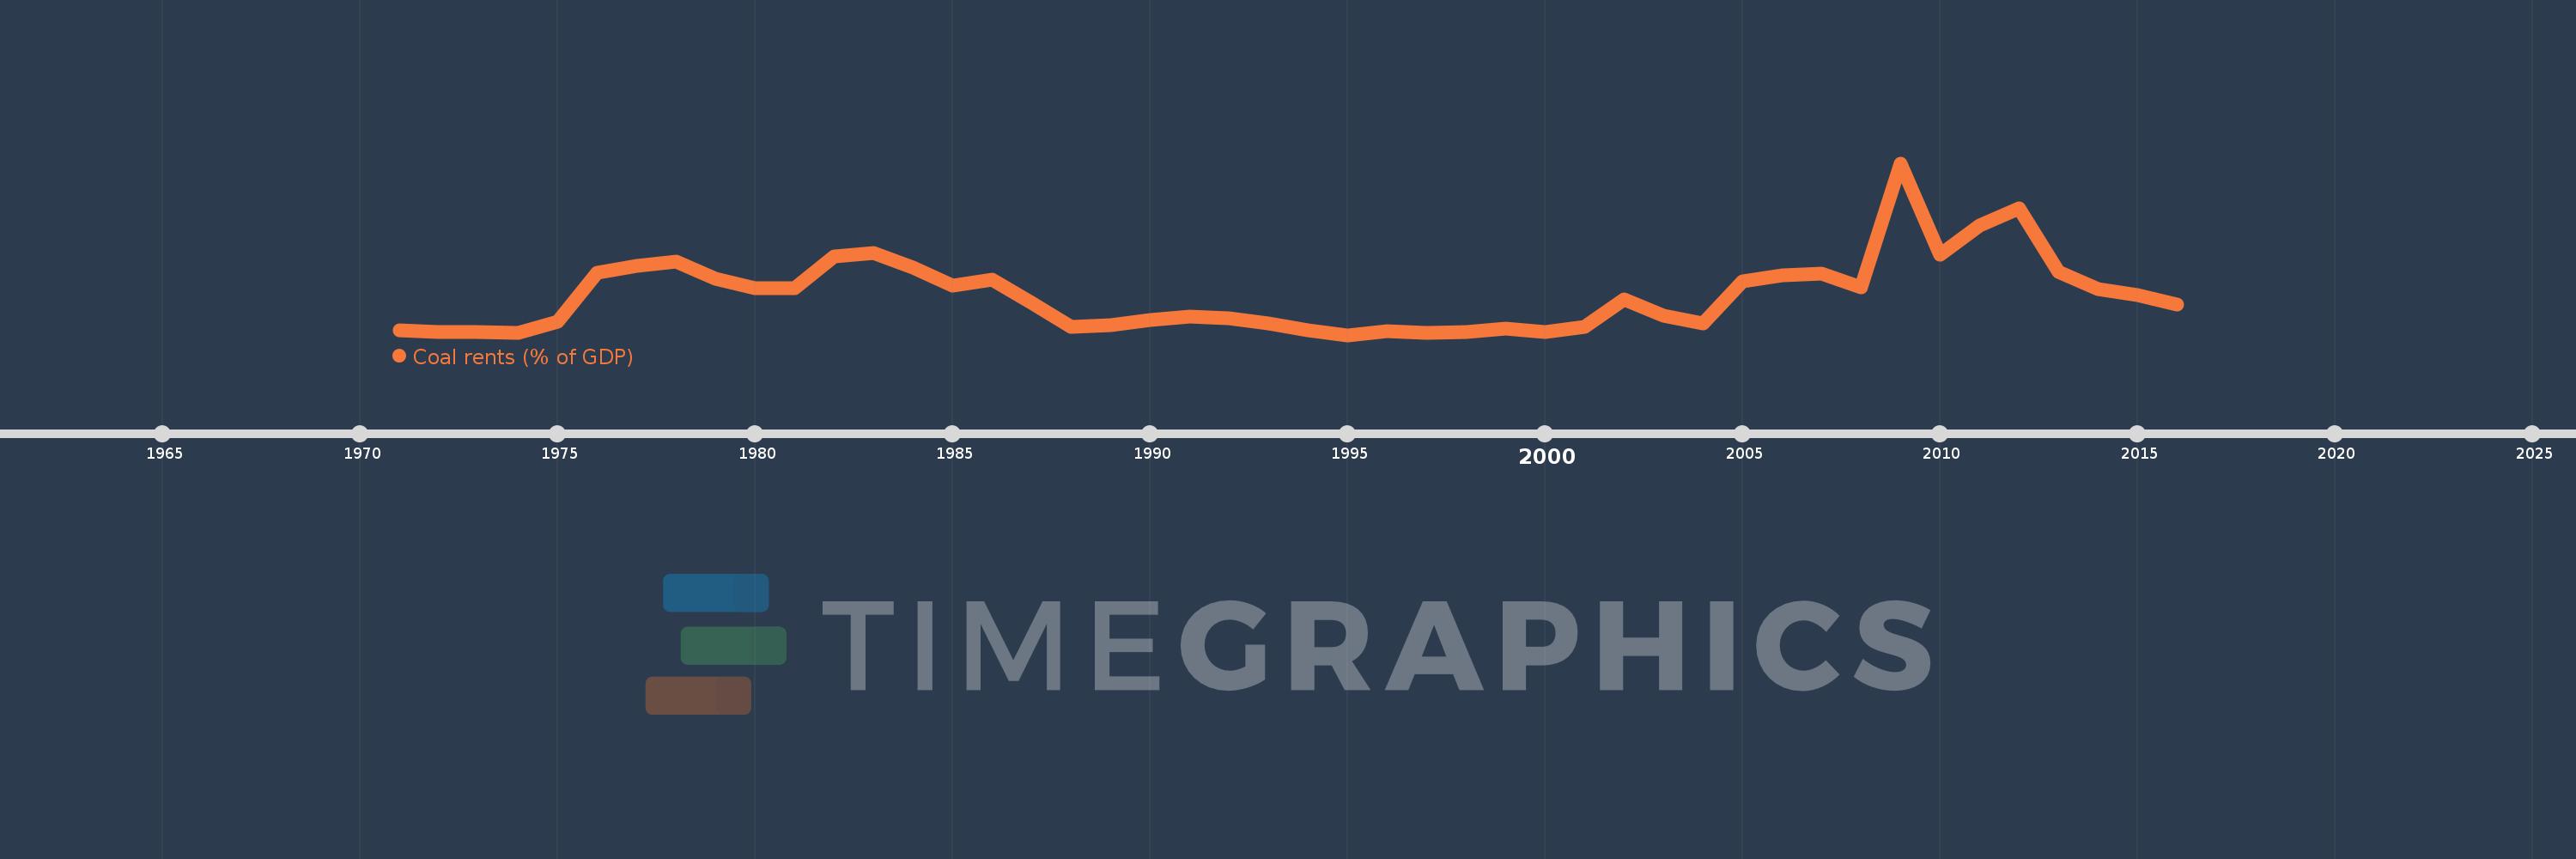
Coal rents (% of GDP)
2016,2015,2014,2013,2012,2011,2010,2009,2008,2007,2006,2005,2004,2003,2002,2001,2000,1999,1998,1997,1996,1995,1994,1993,1992,1991,1990,1989,1988,1987,1986,1985,1984,1983,1982,1981,1980,1979,1978,1977,1976,1975,1974,1973,1972,1971
Queste statistiche in altri paesi:
AfghanistanAlbaniaAlgeriaAngolaAntigua and BarbudaArab WorldArgentinaArmeniaArubaAustraliaAustriaAzerbaijanBahamas, TheBahrainBangladeshBarbadosBelarusBelgiumBelizeBeninBermudaBhutanBoliviaBosnia and HerzegovinaBotswanaBrazilBrunei DarussalamBulgariaBurkina FasoBurundiCabo VerdeCambodiaCameroonCanadaCaribbean small statesCayman IslandsCentral African RepublicCentral Europe and the BalticsChadChileChinaColombiaComorosCongo, Dem. Rep.Congo, Rep.Costa RicaCote d'IvoireCroatiaCubaCyprusCzech RepublicDenmarkDjiboutiDominicaDominican RepublicEarly-demographic dividendEast Asia & PacificEast Asia & Pacific (excluding high income)East Asia & Pacific (IDA & IBRD countries)EcuadorEgypt, Arab Rep.El SalvadorEquatorial GuineaEritreaEstoniaEthiopiaEuro areaEurope & Central AsiaEurope & Central Asia (excluding high income)Europe & Central Asia (IDA & IBRD countries)European UnionFijiFinlandFragile and conflict affected situationsFranceFrench PolynesiaGabonGambia, TheGeorgiaGermanyGhanaGreeceGreenlandGrenadaGuatemalaGuineaGuinea-BissauGuyanaHaitiHeavily indebted poor countries (HIPC)High incomeHondurasHong Kong SAR, ChinaHungaryIBRD onlyIcelandIDA & IBRD totalIDA blendIDA onlyIDA totalIndiaIndonesiaIran, Islamic Rep.IraqIrelandIsraelItalyJamaicaJapanJordanKazakhstanKenyaKiribatiKorea, Rep.KosovoKuwaitKyrgyz RepublicLao PDRLate-demographic dividendLatin America & Caribbean Latin America & Caribbean (excluding high income)Latin America & the Caribbean (IDA & IBRD countries)LatviaLeast developed countries: UN classificationLebanonLesothoLiberiaLibyaLithuaniaLow & middle incomeLow incomeLower middle incomeLuxembourgMacao SAR, ChinaMacedonia, FYRMadagascarMalawiMalaysiaMaldivesMaliMaltaMauritaniaMauritiusMexicoMiddle East & North AfricaMiddle East & North Africa (excluding high income)Middle East & North Africa (IDA & IBRD countries)Middle incomeMoldovaMongoliaMontenegroMoroccoMozambiqueMyanmarNamibiaNepalNetherlandsNew CaledoniaNew ZealandNicaraguaNigerNigeriaNorth AmericaNorwayOECD membersOmanOther small statesPacific island small statesPakistanPanamaPapua New GuineaParaguayPeruPhilippinesPolandPortugalPost-demographic dividendPre-demographic dividendPuerto RicoQatarRomaniaRussian FederationRwandaSamoaSao Tome and PrincipeSaudi ArabiaSenegalSerbiaSeychellesSierra LeoneSingaporeSlovak RepublicSloveniaSmall statesSolomon IslandsSouth AfricaSouth AsiaSouth Asia (IDA & IBRD)SpainSri LankaSt. Kitts and NevisSt. LuciaSt. Vincent and the GrenadinesSub-Saharan Africa Sub-Saharan Africa (excluding high income)Sub-Saharan Africa (IDA & IBRD countries)SudanSurinameSwazilandSwedenSwitzerlandSyrian Arab RepublicTajikistanTanzaniaThailandTimor-LesteTogoTongaTrinidad and TobagoTunisiaTurkeyTurkmenistanUgandaUkraineUnited Arab EmiratesUnited KingdomUnited StatesUpper middle incomeUruguayUzbekistanVanuatuVenezuela, RBVietnamVirgin Islands (U.S.)West Bank and GazaWorldYemen, Rep.ZambiaZimbabwe Linea del tempo:
Questa scala temporale mostra un grafico dal 1971 anno al 2016 anno. Australia. I dati fino ad 1970 anno non disponibili. Il numero di osservazioni attuali secondo i date: 46.
La fonte (nome):
Indicatori dello sviluppo mondiale
La fonte (organizzazione):
Estimates based on sources and methods described in "The Changing Wealth of Nations: Measuring Sustainable Development in the New Millennium" (World Bank, 2011).
Categorie:
Environment
sono stati aggiornati
23 apr 2017 anni
Indicatori delle variazioni dei valori per anni
Minima:
0.053
1 gen 1995 anni
Massimo:
2.936
1 gen 2009 anni
Alla data di osservazione
Valore
Variazione assoluta
La variazione rispetto al valore precedente
1 gen 1971 anni
0.134
+0.134
0.0%
1 gen 1972 anni
0.101
-0.033
-24.58%
1 gen 1973 anni
0.103
+0.002
1.86%
1 gen 1974 anni
0.096
-0.007
-6.9%
1 gen 1975 anni
0.28
+0.184
192.45%
1 gen 1976 anni
1.094
+0.814
290.79%
1 gen 1977 anni
1.217
+0.123
11.21%
1 gen 1978 anni
1.28
+0.063
5.2%
1 gen 1979 anni
0.99
-0.29
-22.63%
1 gen 1980 anni
0.839
-0.151
-15.29%
1 gen 1981 anni
0.832
-0.007
-0.88%
1 gen 1982 anni
1.376
+0.544
65.42%
1 gen 1983 anni
1.43
+0.054
3.96%
1 gen 1984 anni
1.186
-0.244
-17.03%
1 gen 1985 anni
0.885
-0.302
-25.45%
1 gen 1986 anni
0.988
+0.104
11.75%
1 gen 1987 anni
0.593
-0.396
-40.02%
1 gen 1988 anni
0.195
-0.398
-67.07%
1 gen 1989 anni
0.213
+0.018
9.29%
1 gen 1990 anni
0.302
+0.088
41.3%
1 gen 1991 anni
0.361
+0.059
19.6%
1 gen 1992 anni
0.341
-0.02
-5.43%
1 gen 1993 anni
0.243
-0.098
-28.86%
1 gen 1994 anni
0.139
-0.103
-42.64%
1 gen 1995 anni
0.053
-0.087
-62.18%
1 gen 1996 anni
0.122
+0.069
131.87%
1 gen 1997 anni
0.095
-0.027
-22.49%
1 gen 1998 anni
0.099
+0.005
4.99%
1 gen 1999 anni
0.156
+0.057
57.17%
1 gen 2000 anni
0.103
-0.054
-34.33%
1 gen 2001 anni
0.183
+0.08
78.06%
1 gen 2002 anni
0.658
+0.476
260.57%
1 gen 2003 anni
0.383
-0.275
-41.75%
1 gen 2004 anni
0.244
-0.14
-36.42%
1 gen 2005 anni
0.955
+0.712
291.96%
1 gen 2006 anni
1.057
+0.102
10.65%
1 gen 2007 anni
1.09
+0.033
3.13%
1 gen 2008 anni
0.848
-0.242
-22.17%
1 gen 2009 anni
2.936
+2.087
246.01%
1 gen 2010 anni
1.402
-1.533
-52.24%
1 gen 2011 anni
1.89
+0.488
34.81%
1 gen 2012 anni
2.182
+0.292
15.43%
1 gen 2013 anni
1.109
-1.073
-49.16%
1 gen 2014 anni
0.825
-0.285
-25.66%
1 gen 2015 anni
0.725
-0.1
-12.14%
1 gen 2016 anni
0.559
-0.165
-22.82%
Classificazione dei paesi secondo i statistiche attuali per anni


Commenti: