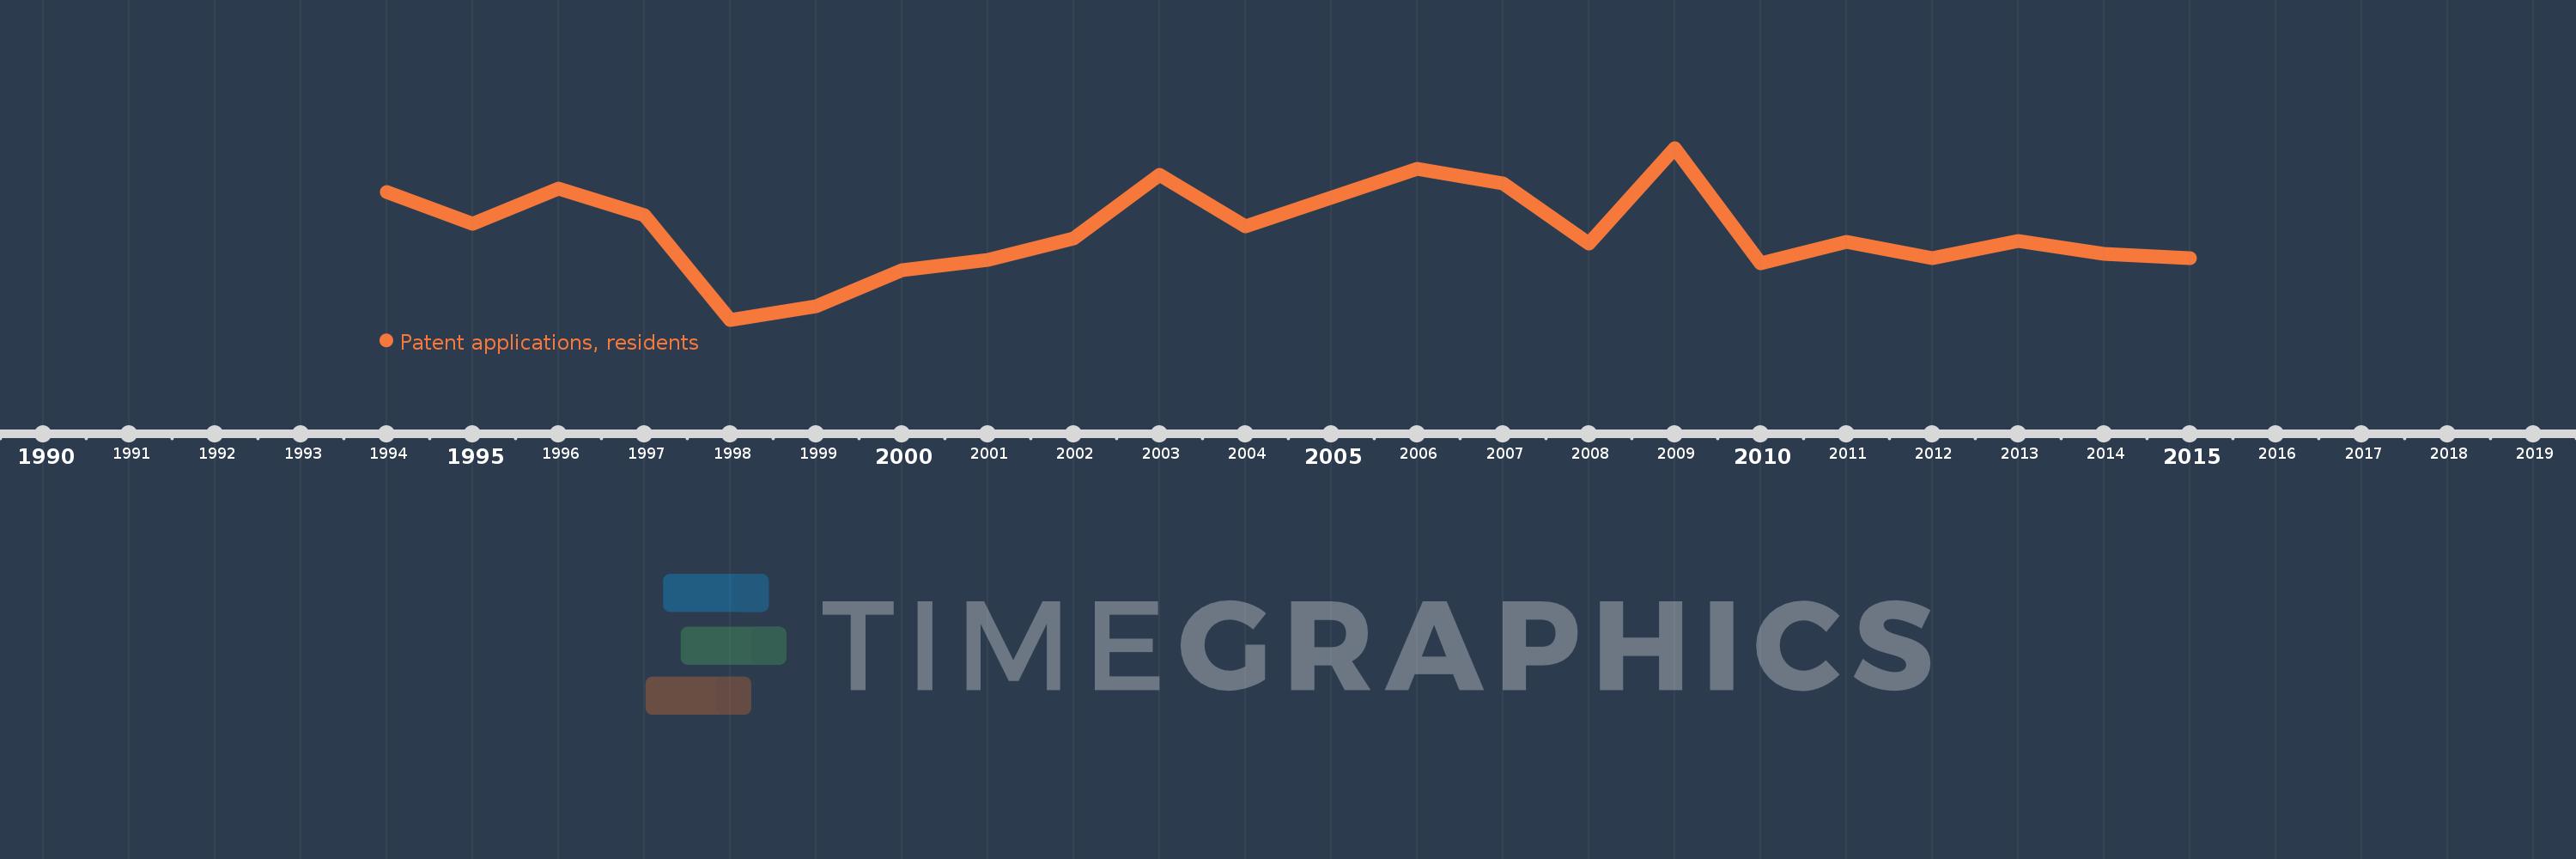
Questa scala temporale mostra un grafico dal 1994 anno al 2015 anno. Armenia. I dati fino ad 1993 anno non disponibili. Il numero di osservazioni attuali secondo i date: 21.
La fonte (nome):
Indicatori dello sviluppo mondiale
La fonte (organizzazione):
World Intellectual Property Organization (WIPO), WIPO Patent Report: Statistics on Worldwide Patent Activity. The International Bureau of WIPO assumes no responsibility with respect to the transformation of these data.
Categorie:
Science & Technology
sono stati aggiornati
23 apr 2017 anni
Indicatori delle variazioni dei valori per anni
In media:
145.619
Minima:
62.0
1 gen 1998 anni
Massimo:
226.0
1 gen 2009 anni
Alla data di osservazione
Valore
Variazione assoluta
La variazione rispetto al valore precedente
1 gen 1994 anni
184.0
+184.0
0.0%
1 gen 1995 anni
154.0
-30.0
-16.3%
1 gen 1996 anni
187.0
+33.0
21.43%
1 gen 1997 anni
162.0
-25.0
-13.37%
1 gen 1998 anni
62.0
-100.0
-61.73%
1 gen 1999 anni
75.0
+13.0
20.97%
1 gen 2000 anni
109.0
+34.0
45.33%
1 gen 2001 anni
119.0
+10.0
9.17%
1 gen 2002 anni
140.0
+21.0
17.65%
1 gen 2003 anni
200.0
+60.0
42.86%
1 gen 2004 anni
151.0
-49.0
-24.5%
1 gen 2006 anni
206.0
+55.0
36.42%
1 gen 2007 anni
192.0
-14.0
-6.8%
1 gen 2008 anni
135.0
-57.0
-29.69%
1 gen 2009 anni
226.0
+91.0
67.41%
1 gen 2010 anni
116.0
-110.0
-48.67%
1 gen 2011 anni
136.0
+20.0
17.24%
1 gen 2012 anni
121.0
-15.0
-11.03%
1 gen 2013 anni
137.0
+16.0
13.22%
1 gen 2014 anni
125.0
-12.0
-8.76%
1 gen 2015 anni
121.0
-4.0
-3.2%
Classificazione dei paesi secondo i statistiche attuali per anni
