29
/it/
it
AIzaSyAYiBZKx7MnpbEhh9jyipgxe19OcubqV5w
April 1, 2024
69403
Argentina
ARG
true
2
1
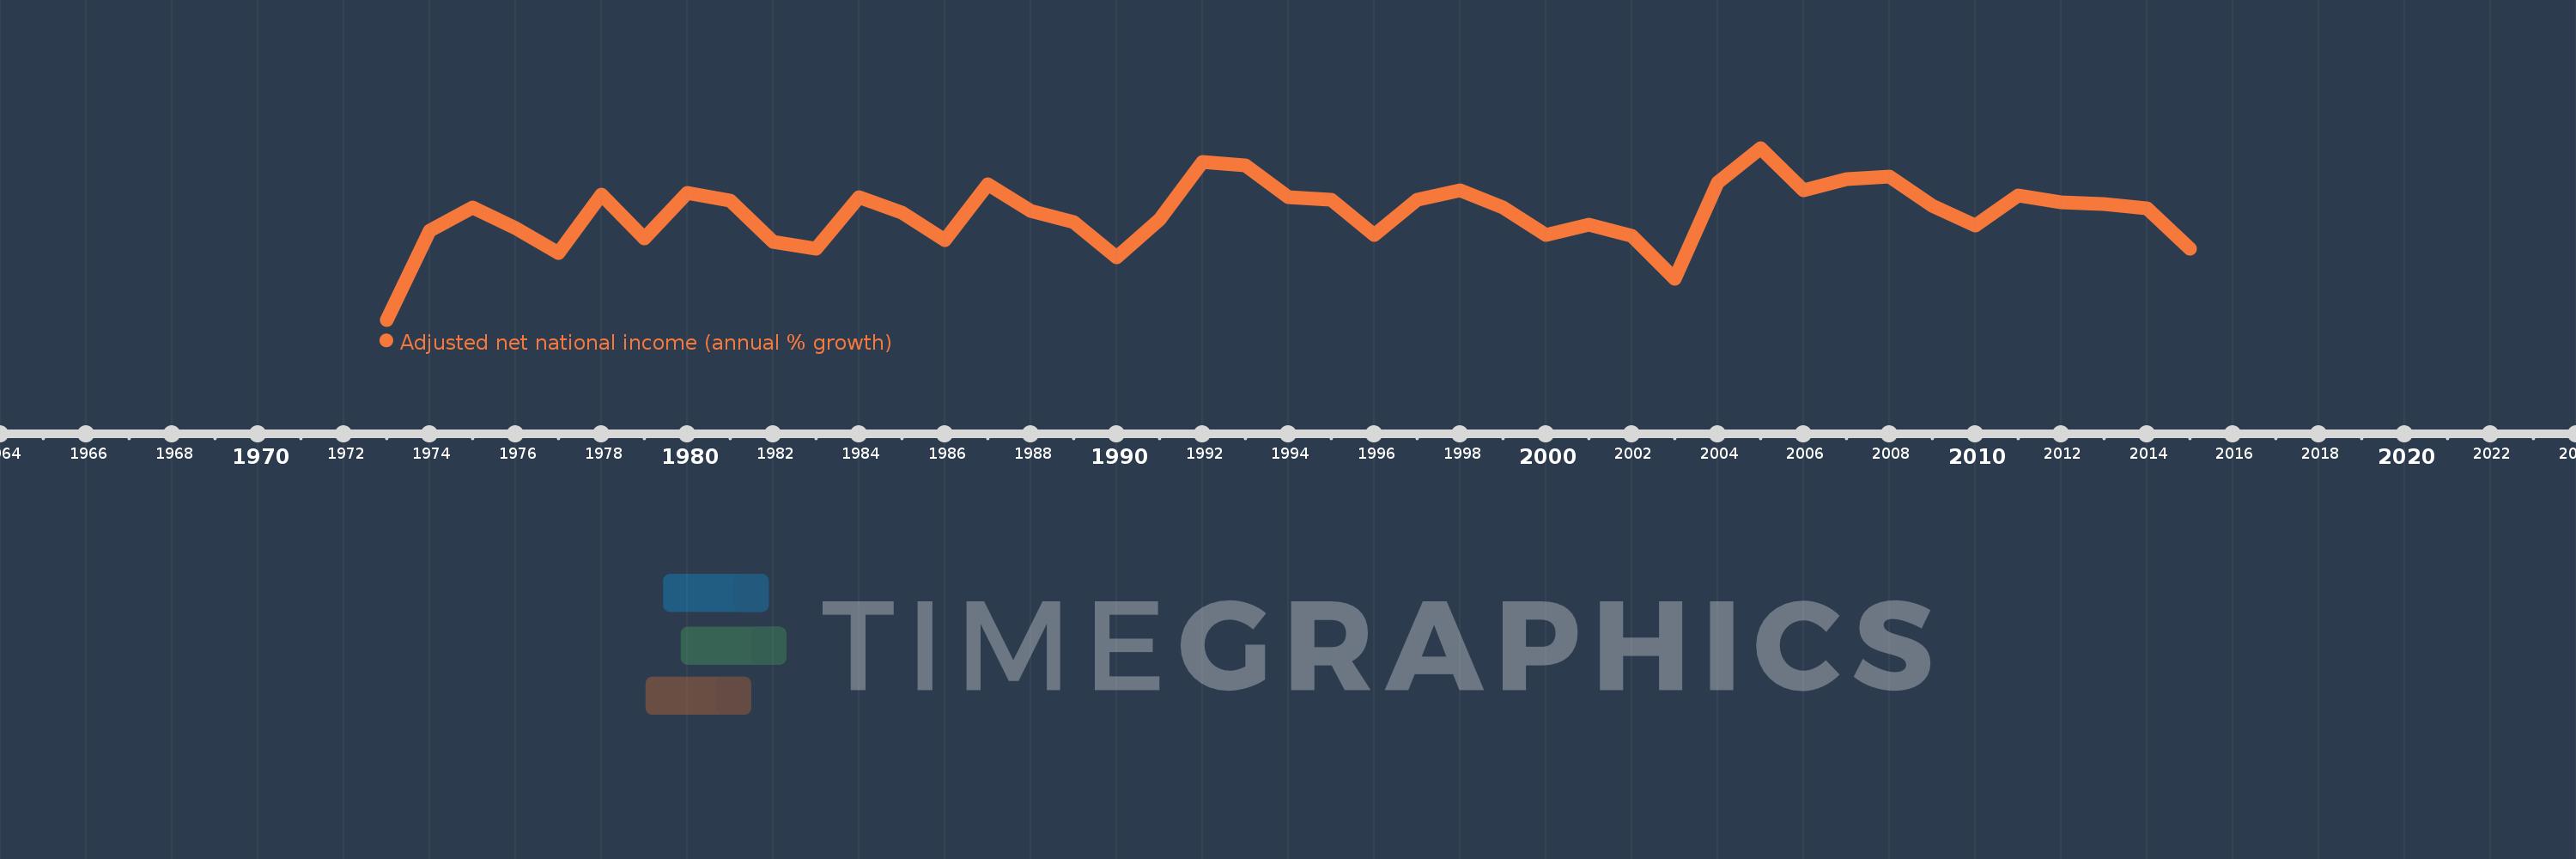
Adjusted net national income (annual % growth)
2015,2014,2013,2012,2011,2010,2009,2008,2007,2006,2005,2004,2003,2002,2001,2000,1999,1998,1997,1996,1995,1994,1993,1992,1991,1990,1989,1988,1987,1986,1985,1984,1983,1982,1981,1980,1979,1978,1977,1976,1975,1974,1973
Queste statistiche in altri paesi:
Linea del tempo:
Questa scala temporale mostra un grafico dal 1973 anno al 2015 anno. Argentina. I dati fino ad 1972 anno non disponibili. Il numero di osservazioni attuali secondo i date: 43.
La fonte (nome):
Indicatori dello sviluppo mondiale
La fonte (organizzazione):
World Bank staff estimates based on sources and methods in World Bank's "The Changing Wealth of Nations: Measuring Sustainable Development in the New Millennium" (2011).
Categorie:
Economy & Growth
sono stati aggiornati
23 apr 2017 anni
Indicatori delle variazioni dei valori per anni
Minima:
-38.179
1 gen 1973 anni
Massimo:
26.045
1 gen 2005 anni
Alla data di osservazione
Valore
Variazione assoluta
La variazione rispetto al valore precedente
1 gen 1973 anni
-38.179
-38.179
0.0%
1 gen 1974 anni
-4.922
+33.256
-87.11%
1 gen 1975 anni
3.746
+8.669
-176.11%
1 gen 1976 anni
-3.988
-7.734
-206.45%
1 gen 1977 anni
-13.077
-9.089
227.92%
1 gen 1978 anni
8.694
+21.772
-166.49%
1 gen 1979 anni
-7.928
-16.622
-191.18%
1 gen 1980 anni
9.219
+17.146
-216.28%
1 gen 1981 anni
6.21
-3.008
-32.63%
1 gen 1982 anni
-9.084
-15.295
-246.27%
1 gen 1983 anni
-11.599
-2.515
27.69%
1 gen 1984 anni
7.71
+19.31
-166.47%
1 gen 1985 anni
1.943
-5.767
-74.8%
1 gen 1986 anni
-8.331
-10.274
-528.7%
1 gen 1987 anni
12.499
+20.83
-250.04%
1 gen 1988 anni
2.448
-10.051
-80.41%
1 gen 1989 anni
-1.769
-4.217
-172.24%
1 gen 1990 anni
-14.961
-13.192
745.86%
1 gen 1991 anni
-0.769
+14.192
-94.86%
1 gen 1992 anni
20.97
+21.739
-2.83 Mille.%
1 gen 1993 anni
19.498
-1.472
-7.02%
1 gen 1994 anni
7.709
-11.789
-60.46%
1 gen 1995 anni
6.609
-1.1
-14.27%
1 gen 1996 anni
-6.555
-13.164
-199.18%
1 gen 1997 anni
6.521
+13.076
-199.49%
1 gen 1998 anni
10.141
+3.62
55.52%
1 gen 1999 anni
3.663
-6.479
-63.88%
1 gen 2000 anni
-6.383
-10.046
-274.26%
1 gen 2001 anni
-2.666
+3.717
-58.24%
1 gen 2002 anni
-6.915
-4.25
159.43%
1 gen 2003 anni
-22.776
-15.86
229.35%
1 gen 2004 anni
13.18
+35.956
-157.87%
1 gen 2005 anni
26.045
+12.865
97.61%
1 gen 2006 anni
10.236
-15.809
-60.7%
1 gen 2007 anni
14.448
+4.212
41.15%
1 gen 2008 anni
15.434
+0.986
6.82%
1 gen 2009 anni
4.483
-10.951
-70.95%
1 gen 2010 anni
-3.096
-7.579
-169.06%
1 gen 2011 anni
8.224
+11.319
-365.64%
1 gen 2012 anni
5.721
-2.502
-30.43%
1 gen 2013 anni
5.028
-0.693
-12.11%
1 gen 2014 anni
3.406
-1.622
-32.26%
1 gen 2015 anni
-11.719
-15.125
-444.04%
Classificazione dei paesi secondo i statistiche attuali per anni


Commenti: