30
/it/
AIzaSyAYiBZKx7MnpbEhh9jyipgxe19OcubqV5w
April 1, 2024
66633
Algeria
DZA
true
2
1
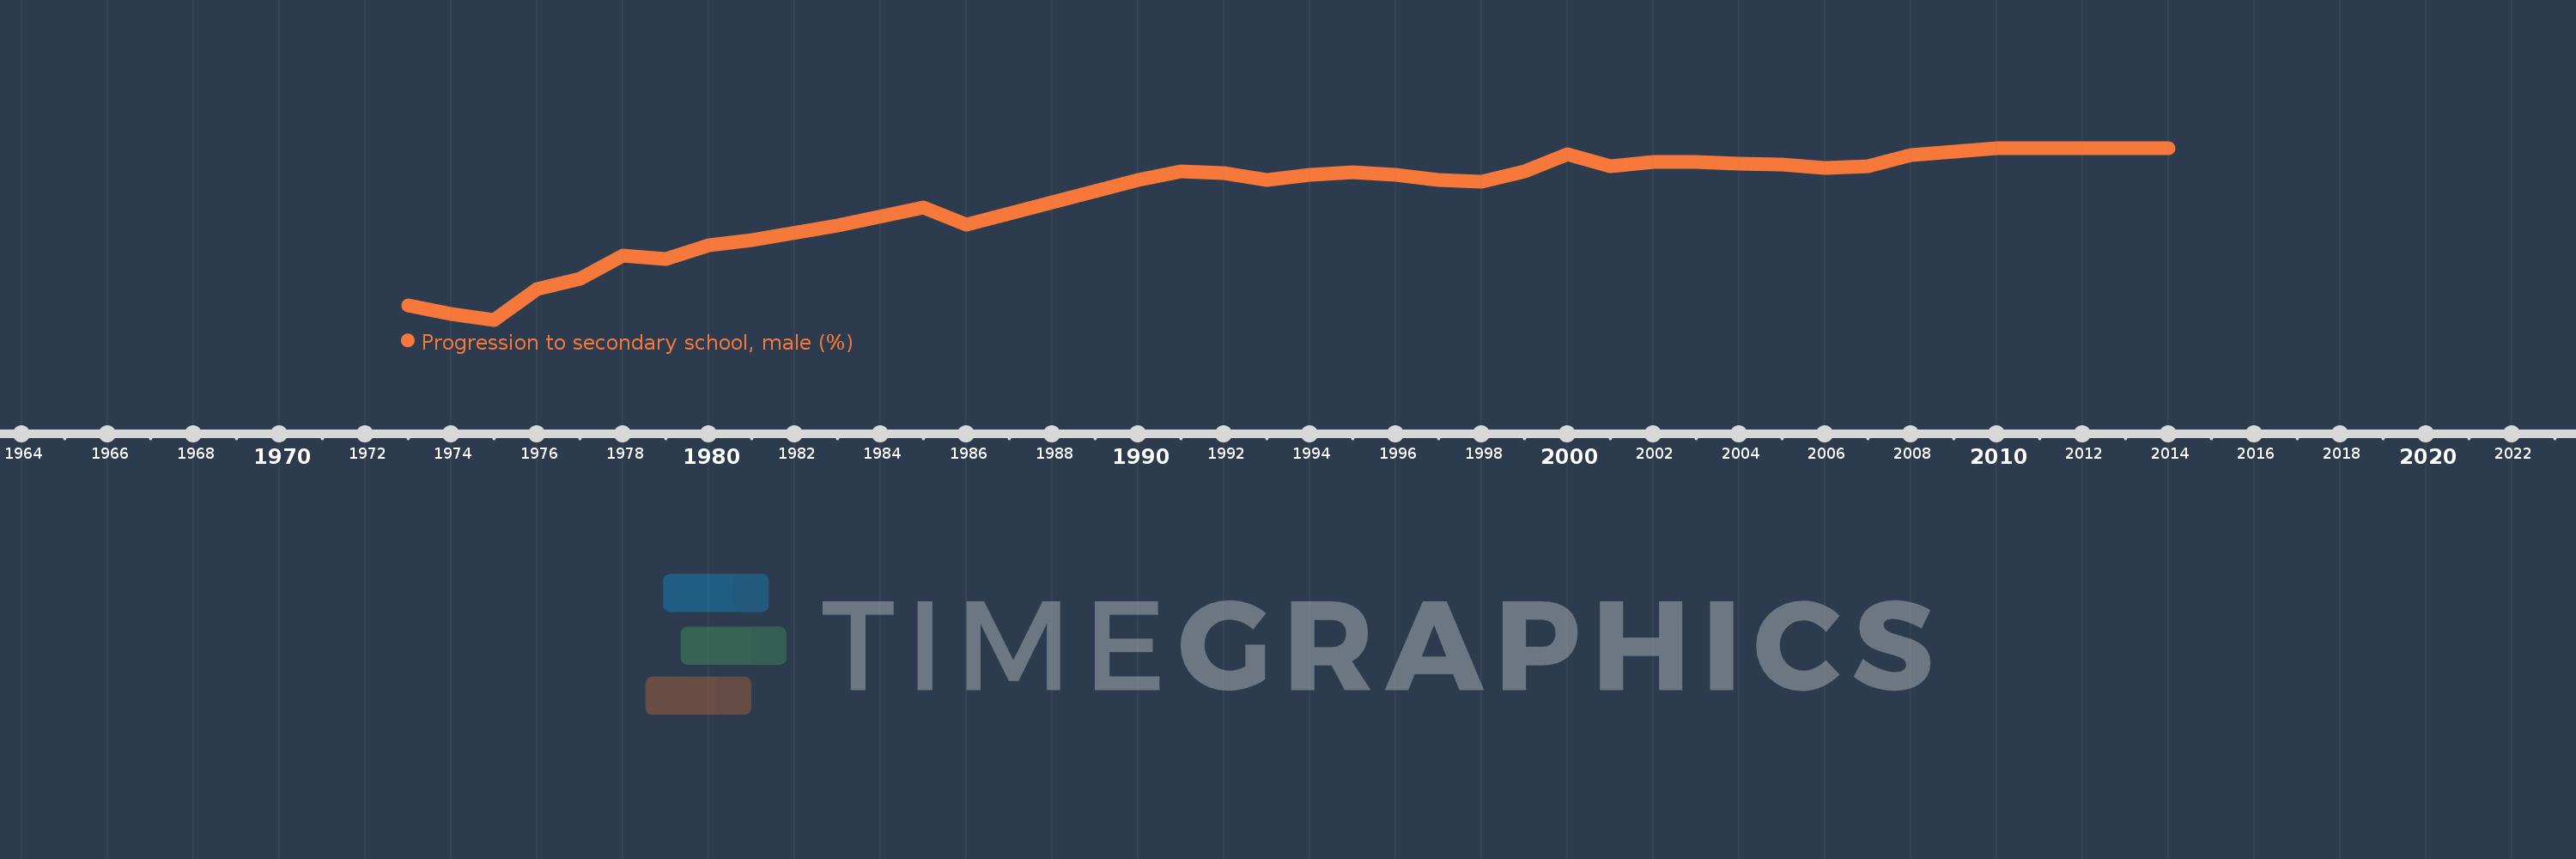
Progression to secondary school, male (%)
2014,2013,2012,2011,2010,2008,2007,2006,2005,2004,2003,2002,2001,2000,1999,1998,1997,1996,1995,1994,1993,1992,1991,1990,1986,1985,1983,1981,1980,1979,1978,1977,1976,1975,1974,1973
