29
/it/
it
AIzaSyAYiBZKx7MnpbEhh9jyipgxe19OcubqV5w
April 1, 2024
63601
Afghanistan
AFG
true
2
1
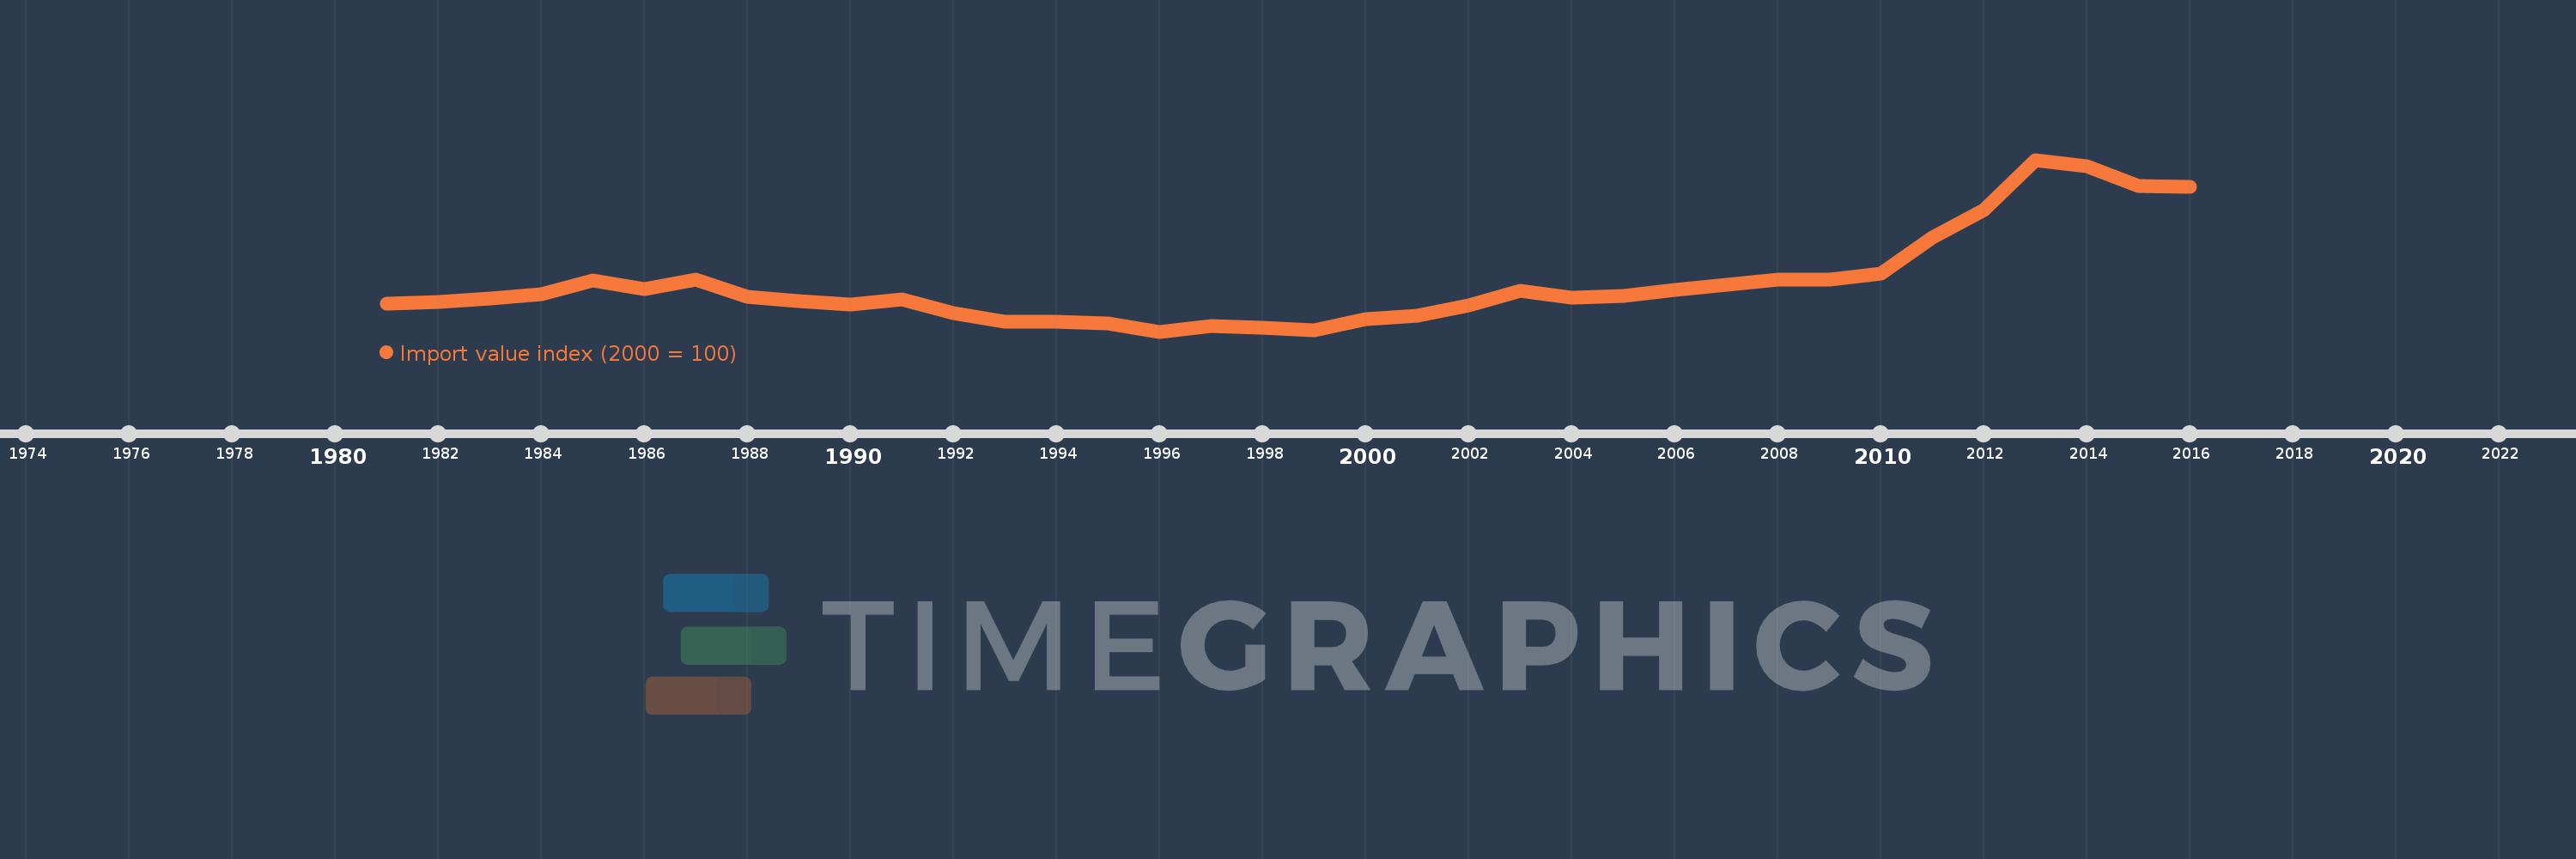
Import value index (2000 = 100)
2016,2015,2014,2013,2012,2011,2010,2009,2008,2007,2006,2005,2004,2003,2002,2001,2000,1999,1998,1997,1996,1995,1994,1993,1992,1991,1990,1989,1988,1987,1986,1985,1984,1983,1982,1981
Queste statistiche in altri paesi:
AfghanistanAlbaniaAlgeriaAmerican SamoaAndorraAngolaAntigua and BarbudaArgentinaArmeniaArubaAustraliaAustriaAzerbaijanBahamas, TheBahrainBangladeshBarbadosBelarusBelgiumBelizeBeninBermudaBhutanBoliviaBosnia and HerzegovinaBotswanaBrazilBritish Virgin IslandsBrunei DarussalamBulgariaBurkina FasoBurundiCabo VerdeCambodiaCameroonCanadaCayman IslandsCentral African RepublicChadChileChinaColombiaComorosCongo, Dem. Rep.Congo, Rep.Costa RicaCote d'IvoireCroatiaCubaCuracaoCyprusCzech RepublicDenmarkDjiboutiDominicaDominican RepublicEcuadorEgypt, Arab Rep.El SalvadorEquatorial GuineaEritreaEstoniaEthiopiaFaroe IslandsFijiFinlandFranceFrench PolynesiaGabonGambia, TheGeorgiaGermanyGhanaGibraltarGreeceGreenlandGrenadaGuamGuatemalaGuineaGuinea-BissauGuyanaHaitiHondurasHong Kong SAR, ChinaHungaryIcelandIndiaIndonesiaIran, Islamic Rep.IraqIrelandIsraelItalyJamaicaJapanJordanKazakhstanKenyaKiribatiKorea, Dem. People’s Rep.Korea, Rep.KuwaitKyrgyz RepublicLao PDRLatviaLebanonLesothoLiberiaLibyaLithuaniaLuxembourgMacao SAR, ChinaMacedonia, FYRMadagascarMalawiMalaysiaMaldivesMaliMaltaMarshall IslandsMauritaniaMauritiusMexicoMicronesia, Fed. Sts.MoldovaMongoliaMoroccoMozambiqueMyanmarNamibiaNauruNepalNetherlandsNew CaledoniaNew ZealandNicaraguaNigerNigeriaNorthern Mariana IslandsNorwayOmanPakistanPalauPanamaPapua New GuineaParaguayPeruPhilippinesPolandPortugalQatarRomaniaRussian FederationRwandaSamoaSao Tome and PrincipeSaudi ArabiaSenegalSerbiaSeychellesSierra LeoneSingaporeSlovak RepublicSloveniaSolomon IslandsSomaliaSouth AfricaSpainSri LankaSt. Kitts and NevisSt. LuciaSt. Vincent and the GrenadinesSudanSurinameSwazilandSwedenSwitzerlandSyrian Arab RepublicTajikistanTanzaniaThailandTogoTongaTrinidad and TobagoTunisiaTurkeyTurkmenistanTurks and Caicos IslandsUgandaUkraineUnited Arab EmiratesUnited KingdomUnited StatesUruguayUzbekistanVanuatuVenezuela, RBVietnamWest Bank and GazaYemen, Rep.ZambiaZimbabwe Linea del tempo:
Questa scala temporale mostra un grafico dal 1981 anno al 2016 anno. Afghanistan. I dati fino ad 1980 anno non disponibili. Il numero di osservazioni attuali secondo i date: 36.
La fonte (nome):
Indicatori dello sviluppo mondiale
La fonte (organizzazione):
United Nations Conference on Trade and Development, Handbook of Statistics and data files, and International Monetary Fund, International Financial Statistics.
Categorie:
Private Sector, Trade
sono stati aggiornati
23 apr 2017 anni
Indicatori delle variazioni dei valori per anni
Minima:
32.911
1 gen 1996 anni
Massimo:
771.242
1 gen 2013 anni
Alla data di osservazione
Valore
Variazione assoluta
La variazione rispetto al valore precedente
1 gen 1981 anni
152.891
+152.891
0.0%
1 gen 1982 anni
161.145
+8.255
5.4%
1 gen 1983 anni
174.873
+13.727
8.52%
1 gen 1984 anni
193.509
+18.636
10.66%
1 gen 1985 anni
252.636
+59.127
30.56%
1 gen 1986 anni
217.127
-35.509
-14.06%
1 gen 1987 anni
255.182
+38.055
17.53%
1 gen 1988 anni
181.073
-74.109
-29.04%
1 gen 1989 anni
163.691
-17.382
-9.6%
1 gen 1990 anni
149.391
-14.3
-8.74%
1 gen 1991 anni
170.182
+20.791
13.92%
1 gen 1992 anni
112.0
-58.182
-34.19%
1 gen 1993 anni
74.727
-37.273
-33.28%
1 gen 1994 anni
76.182
+1.455
1.95%
1 gen 1995 anni
68.182
-8.0
-10.5%
1 gen 1996 anni
32.911
-35.271
-51.73%
1 gen 1997 anni
56.212
+23.301
70.8%
1 gen 1998 anni
51.365
-4.847
-8.62%
1 gen 1999 anni
39.297
-12.069
-23.5%
1 gen 2000 anni
86.088
+46.791
119.07%
1 gen 2001 anni
100.0
+13.912
16.16%
1 gen 2002 anni
144.23
+44.23
44.23%
1 gen 2003 anni
208.522
+64.291
44.58%
1 gen 2004 anni
178.672
-29.85
-14.31%
1 gen 2005 anni
185.135
+6.463
3.62%
1 gen 2006 anni
210.116
+24.98
13.49%
1 gen 2007 anni
233.37
+23.255
11.07%
1 gen 2008 anni
256.996
+23.625
10.12%
1 gen 2009 anni
256.814
-0.182
-0.07%
1 gen 2010 anni
283.736
+26.922
10.48%
1 gen 2011 anni
438.325
+154.59
54.48%
1 gen 2012 anni
554.046
+115.72
26.4%
1 gen 2013 anni
771.242
+217.196
39.2%
1 gen 2014 anni
741.902
-29.339
-3.8%
1 gen 2015 anni
657.3
-84.602
-11.4%
1 gen 2016 anni
656.764
-0.536
-0.08%
Classificazione dei paesi secondo i statistiche attuali per anni


Commenti: