29
/it/
it
AIzaSyAYiBZKx7MnpbEhh9jyipgxe19OcubqV5w
April 1, 2024
61213
Sub-Saharan Africa (IDA & IBRD countries)
TSS
false
2
1
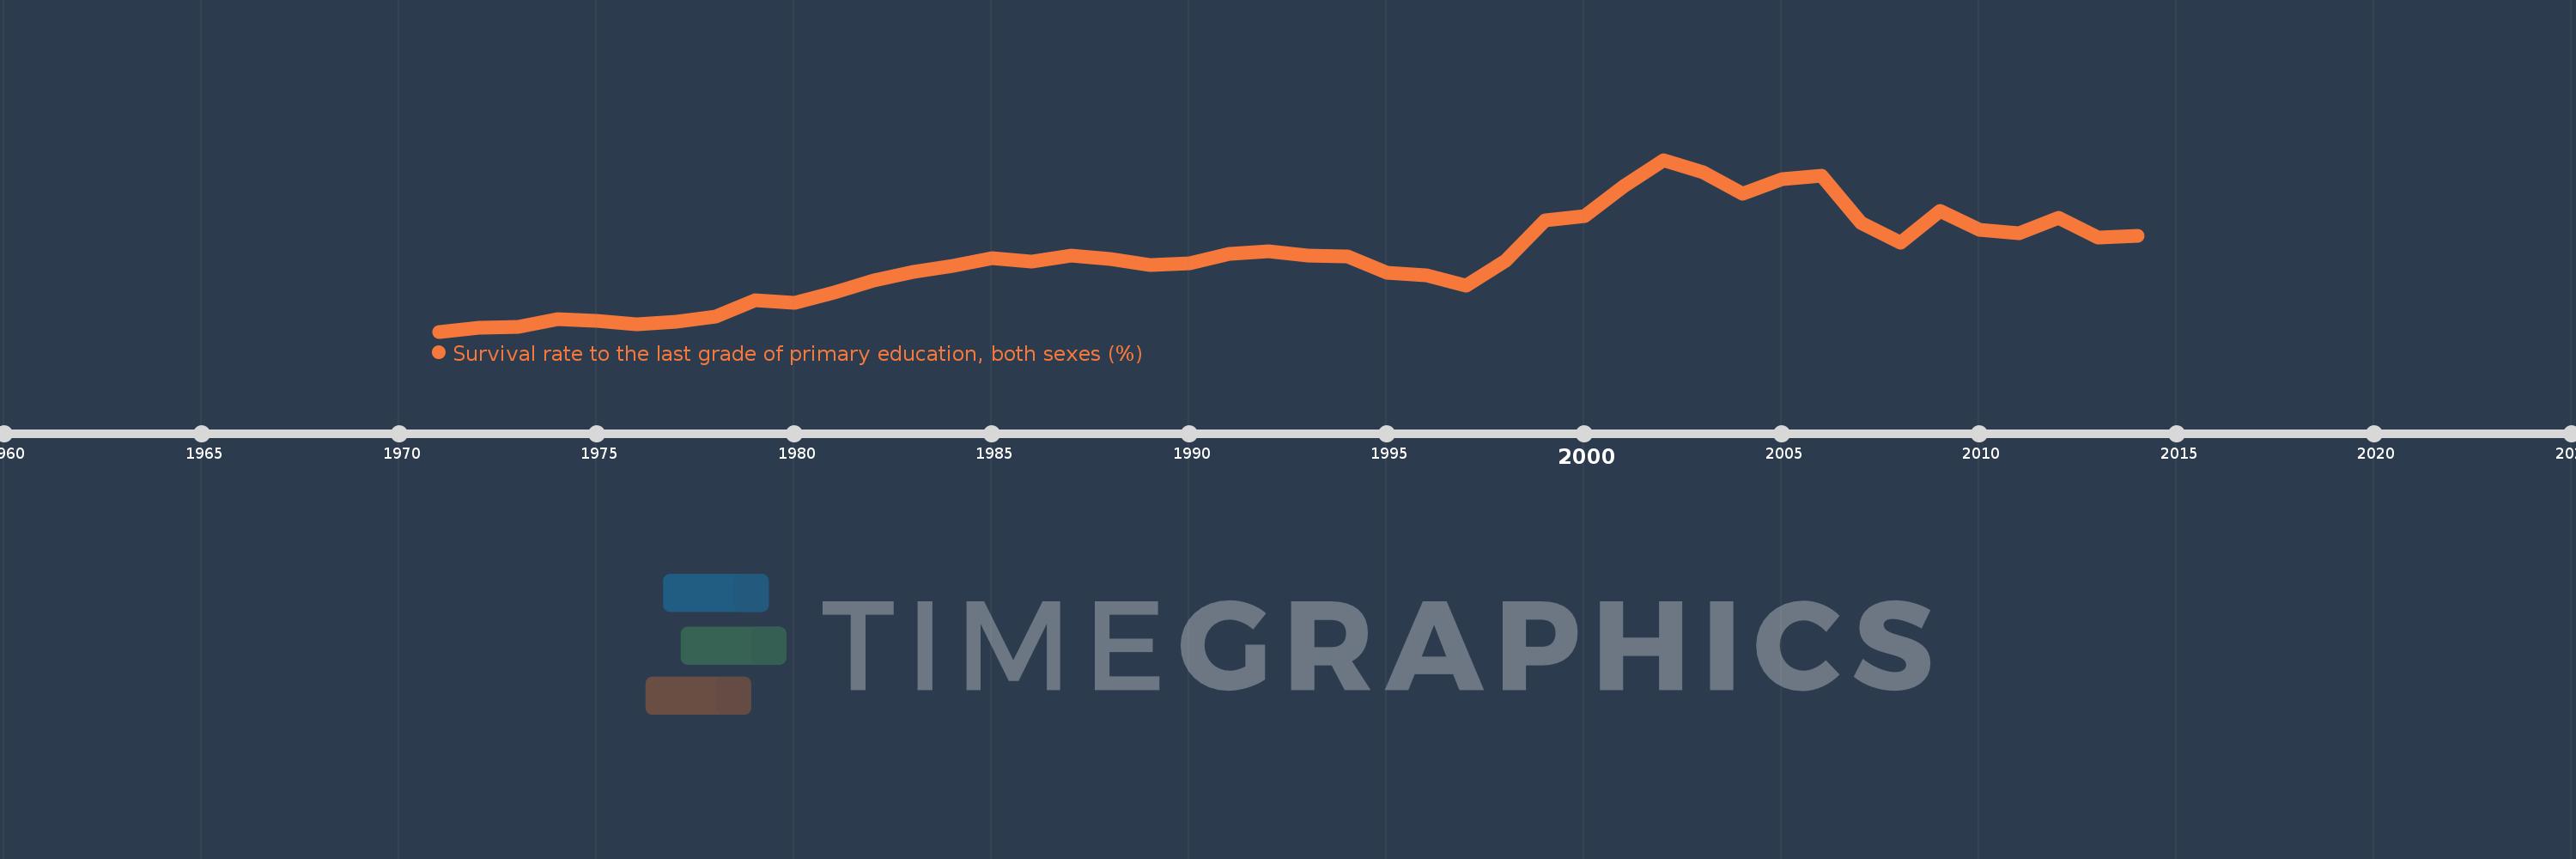
Survival rate to the last grade of primary education, both sexes (%)
2014,2013,2012,2011,2010,2009,2008,2007,2006,2005,2004,2003,2002,2001,2000,1999,1998,1997,1996,1995,1994,1993,1992,1991,1990,1989,1988,1987,1986,1985,1984,1983,1982,1981,1980,1979,1978,1977,1976,1975,1974,1973,1972,1971
Queste statistiche in altri paesi:
AfghanistanAlbaniaAlgeriaAndorraAngolaAntigua and BarbudaArab WorldArgentinaArmeniaArubaAustriaAzerbaijanBahamas, TheBahrainBangladeshBarbadosBelarusBelgiumBelizeBeninBermudaBhutanBoliviaBosnia and HerzegovinaBotswanaBrazilBrunei DarussalamBulgariaBurkina FasoBurundiCabo VerdeCambodiaCameroonCanadaCaribbean small statesCayman IslandsCentral African RepublicCentral Europe and the BalticsChadChileChinaColombiaComorosCongo, Dem. Rep.Congo, Rep.Costa RicaCote d'IvoireCroatiaCubaCyprusCzech RepublicDenmarkDjiboutiDominicaDominican RepublicEarly-demographic dividendEast Asia & PacificEast Asia & Pacific (excluding high income)East Asia & Pacific (IDA & IBRD countries)EcuadorEgypt, Arab Rep.El SalvadorEquatorial GuineaEritreaEstoniaEthiopiaEuro areaEurope & Central AsiaEurope & Central Asia (excluding high income)Europe & Central Asia (IDA & IBRD countries)European UnionFijiFinlandFragile and conflict affected situationsFranceGabonGambia, TheGeorgiaGermanyGhanaGreeceGuatemalaGuineaGuinea-BissauGuyanaHaitiHeavily indebted poor countries (HIPC)High incomeHondurasHong Kong SAR, ChinaHungaryIBRD onlyIcelandIDA & IBRD totalIDA blendIDA onlyIDA totalIndiaIndonesiaIran, Islamic Rep.IraqIsraelItalyJamaicaJapanJordanKazakhstanKenyaKiribatiKorea, Rep.KuwaitKyrgyz RepublicLao PDRLate-demographic dividendLatin America & Caribbean Latin America & Caribbean (excluding high income)Latin America & the Caribbean (IDA & IBRD countries)LatviaLeast developed countries: UN classificationLebanonLesothoLiberiaLibyaLiechtensteinLithuaniaLow & middle incomeLow incomeLower middle incomeLuxembourgMacao SAR, ChinaMacedonia, FYRMadagascarMalawiMalaysiaMaldivesMaliMaltaMarshall IslandsMauritaniaMauritiusMexicoMiddle East & North AfricaMiddle East & North Africa (excluding high income)Middle East & North Africa (IDA & IBRD countries)Middle incomeMoldovaMonacoMongoliaMontenegroMoroccoMozambiqueMyanmarNamibiaNepalNetherlandsNicaraguaNigerNigeriaNorth AmericaNorwayOECD membersOmanOther small statesPacific island small statesPakistanPanamaPapua New GuineaParaguayPeruPhilippinesPolandPortugalPost-demographic dividendPre-demographic dividendQatarRomaniaRussian FederationRwandaSamoaSan MarinoSao Tome and PrincipeSaudi ArabiaSenegalSerbiaSeychellesSierra LeoneSingaporeSlovak RepublicSloveniaSmall statesSolomon IslandsSouth AfricaSouth AsiaSouth Asia (IDA & IBRD)SpainSri LankaSt. Kitts and NevisSt. LuciaSt. Vincent and the GrenadinesSub-Saharan Africa Sub-Saharan Africa (excluding high income)Sub-Saharan Africa (IDA & IBRD countries)SudanSurinameSwazilandSwedenSwitzerlandSyrian Arab RepublicTajikistanTanzaniaThailandTimor-LesteTogoTongaTrinidad and TobagoTunisiaTurkeyUgandaUkraineUnited Arab EmiratesUpper middle incomeUruguayUzbekistanVanuatuVenezuela, RBVietnamWest Bank and GazaWorldYemen, Rep.ZambiaZimbabwe Linea del tempo:
Questa scala temporale mostra un grafico dal 1971 anno al 2014 anno. Sub-Saharan Africa (IDA & IBRD countries). I dati fino ad 1970 anno non disponibili. Il numero di osservazioni attuali secondo i date: 44.
La fonte (nome):
Indicatori dello sviluppo mondiale
La fonte (organizzazione):
UNESCO Institute for Statistics
Categorie:
Education
sono stati aggiornati
23 apr 2017 anni
Indicatori delle variazioni dei valori per anni
Minima:
48.509
1 gen 1971 anni
Massimo:
63.724
1 gen 2002 anni
Alla data di osservazione
Valore
Variazione assoluta
La variazione rispetto al valore precedente
1 gen 1971 anni
48.509
+48.509
0.0%
1 gen 1972 anni
48.831
+0.322
0.66%
1 gen 1973 anni
48.944
+0.113
0.23%
1 gen 1974 anni
49.58
+0.636
1.3%
1 gen 1975 anni
49.432
-0.148
-0.3%
1 gen 1976 anni
49.122
-0.309
-0.63%
1 gen 1977 anni
49.37
+0.248
0.5%
1 gen 1978 anni
49.855
+0.485
0.98%
1 gen 1979 anni
51.321
+1.465
2.94%
1 gen 1980 anni
51.072
-0.249
-0.48%
1 gen 1981 anni
51.937
+0.865
1.69%
1 gen 1982 anni
53.056
+1.119
2.16%
1 gen 1983 anni
53.824
+0.768
1.45%
1 gen 1984 anni
54.361
+0.537
1.0%
1 gen 1985 anni
55.007
+0.645
1.19%
1 gen 1986 anni
54.715
-0.292
-0.53%
1 gen 1987 anni
55.268
+0.553
1.01%
1 gen 1988 anni
54.906
-0.362
-0.66%
1 gen 1989 anni
54.417
-0.488
-0.89%
1 gen 1990 anni
54.529
+0.111
0.2%
1 gen 1991 anni
55.373
+0.844
1.55%
1 gen 1992 anni
55.632
+0.259
0.47%
1 gen 1993 anni
55.214
-0.417
-0.75%
1 gen 1994 anni
55.15
-0.064
-0.12%
1 gen 1995 anni
53.744
-1.406
-2.55%
1 gen 1996 anni
53.477
-0.267
-0.5%
1 gen 1997 anni
52.568
-0.909
-1.7%
1 gen 1998 anni
54.814
+2.246
4.27%
1 gen 1999 anni
58.36
+3.546
6.47%
1 gen 2000 anni
58.745
+0.385
0.66%
1 gen 2001 anni
61.406
+2.662
4.53%
1 gen 2002 anni
63.724
+2.318
3.77%
1 gen 2003 anni
62.602
-1.122
-1.76%
1 gen 2004 anni
60.723
-1.879
-3.0%
1 gen 2005 anni
62.003
+1.28
2.11%
1 gen 2006 anni
62.307
+0.304
0.49%
1 gen 2007 anni
58.163
-4.144
-6.65%
1 gen 2008 anni
56.364
-1.799
-3.09%
1 gen 2009 anni
59.219
+2.856
5.07%
1 gen 2010 anni
57.51
-1.709
-2.89%
1 gen 2011 anni
57.225
-0.285
-0.5%
1 gen 2012 anni
58.571
+1.346
2.35%
1 gen 2013 anni
56.829
-1.742
-2.97%
1 gen 2014 anni
56.954
+0.124
0.22%
Classificazione dei paesi secondo i statistiche attuali per anni


Commenti: