30
/it/
AIzaSyAYiBZKx7MnpbEhh9jyipgxe19OcubqV5w
April 1, 2024
59554
Sub-Saharan Africa (excluding high income)
SSA
false
2
1
Average transaction cost of sending remittances to a specific country (%)
2016,2015,2014,2013,2012
Download
Biblioteca di statistiche globali →Sub-Saharan Africa (excluding high income) →

Average transaction cost of sending remittances to a specific country (%)

Queste statistiche in altri paesi:

AfghanistanAlbaniaAlgeriaAngolaArab WorldArmeniaAzerbaijanBangladeshBelarusBoliviaBosnia and HerzegovinaBotswanaBrazilBulgariaCabo VerdeCambodiaCameroonCaribbean small statesCentral Europe and the BalticsChinaColombiaCongo, Rep.Costa RicaCote d'IvoireCroatiaDominican RepublicEarly-demographic dividendEast Asia & Pacific (excluding high income)East Asia & Pacific (IDA & IBRD countries)EcuadorEgypt, Arab Rep.El SalvadorEritreaEstoniaEthiopiaEurope & Central AsiaEurope & Central Asia (excluding high income)Europe & Central Asia (IDA & IBRD countries)FijiFragile and conflict affected situationsGambia, TheGeorgiaGhanaGuatemalaGuyanaHaitiHeavily indebted poor countries (HIPC)HondurasHungaryIBRD onlyIDA & IBRD totalIDA blendIDA onlyIDA totalIndiaIndonesiaJamaicaJordanKazakhstanKenyaKiribatiKorea, Rep.KosovoKyrgyz RepublicLao PDRLate-demographic dividendLatin America & Caribbean Latin America & Caribbean (excluding high income)Latin America & the Caribbean (IDA & IBRD countries)LatviaLeast developed countries: UN classificationLebanonLesothoLiberiaLithuaniaLow & middle incomeLow incomeLower middle incomeMacedonia, FYRMadagascarMalawiMalaysiaMaliMexicoMiddle East & North Africa (excluding high income)Middle East & North Africa (IDA & IBRD countries)Middle incomeMoldovaMoroccoMozambiqueMyanmarNepalNicaraguaNigeriaPakistanPanamaPapua New GuineaParaguayPeruPhilippinesPolandPre-demographic dividendRomaniaRwandaSamoaSenegalSerbiaSierra LeoneSolomon IslandsSomaliaSouth AfricaSouth AsiaSouth Asia (IDA & IBRD)Sri LankaSub-Saharan Africa Sub-Saharan Africa (excluding high income)Sub-Saharan Africa (IDA & IBRD countries)SudanSurinameSwazilandSyrian Arab RepublicTajikistanTanzaniaThailandTogoTongaTunisiaTurkeyTuvaluUgandaUkraineUpper middle incomeUzbekistanVanuatuVietnamWorldYemen, Rep.ZambiaZimbabwe

Linea del tempo:

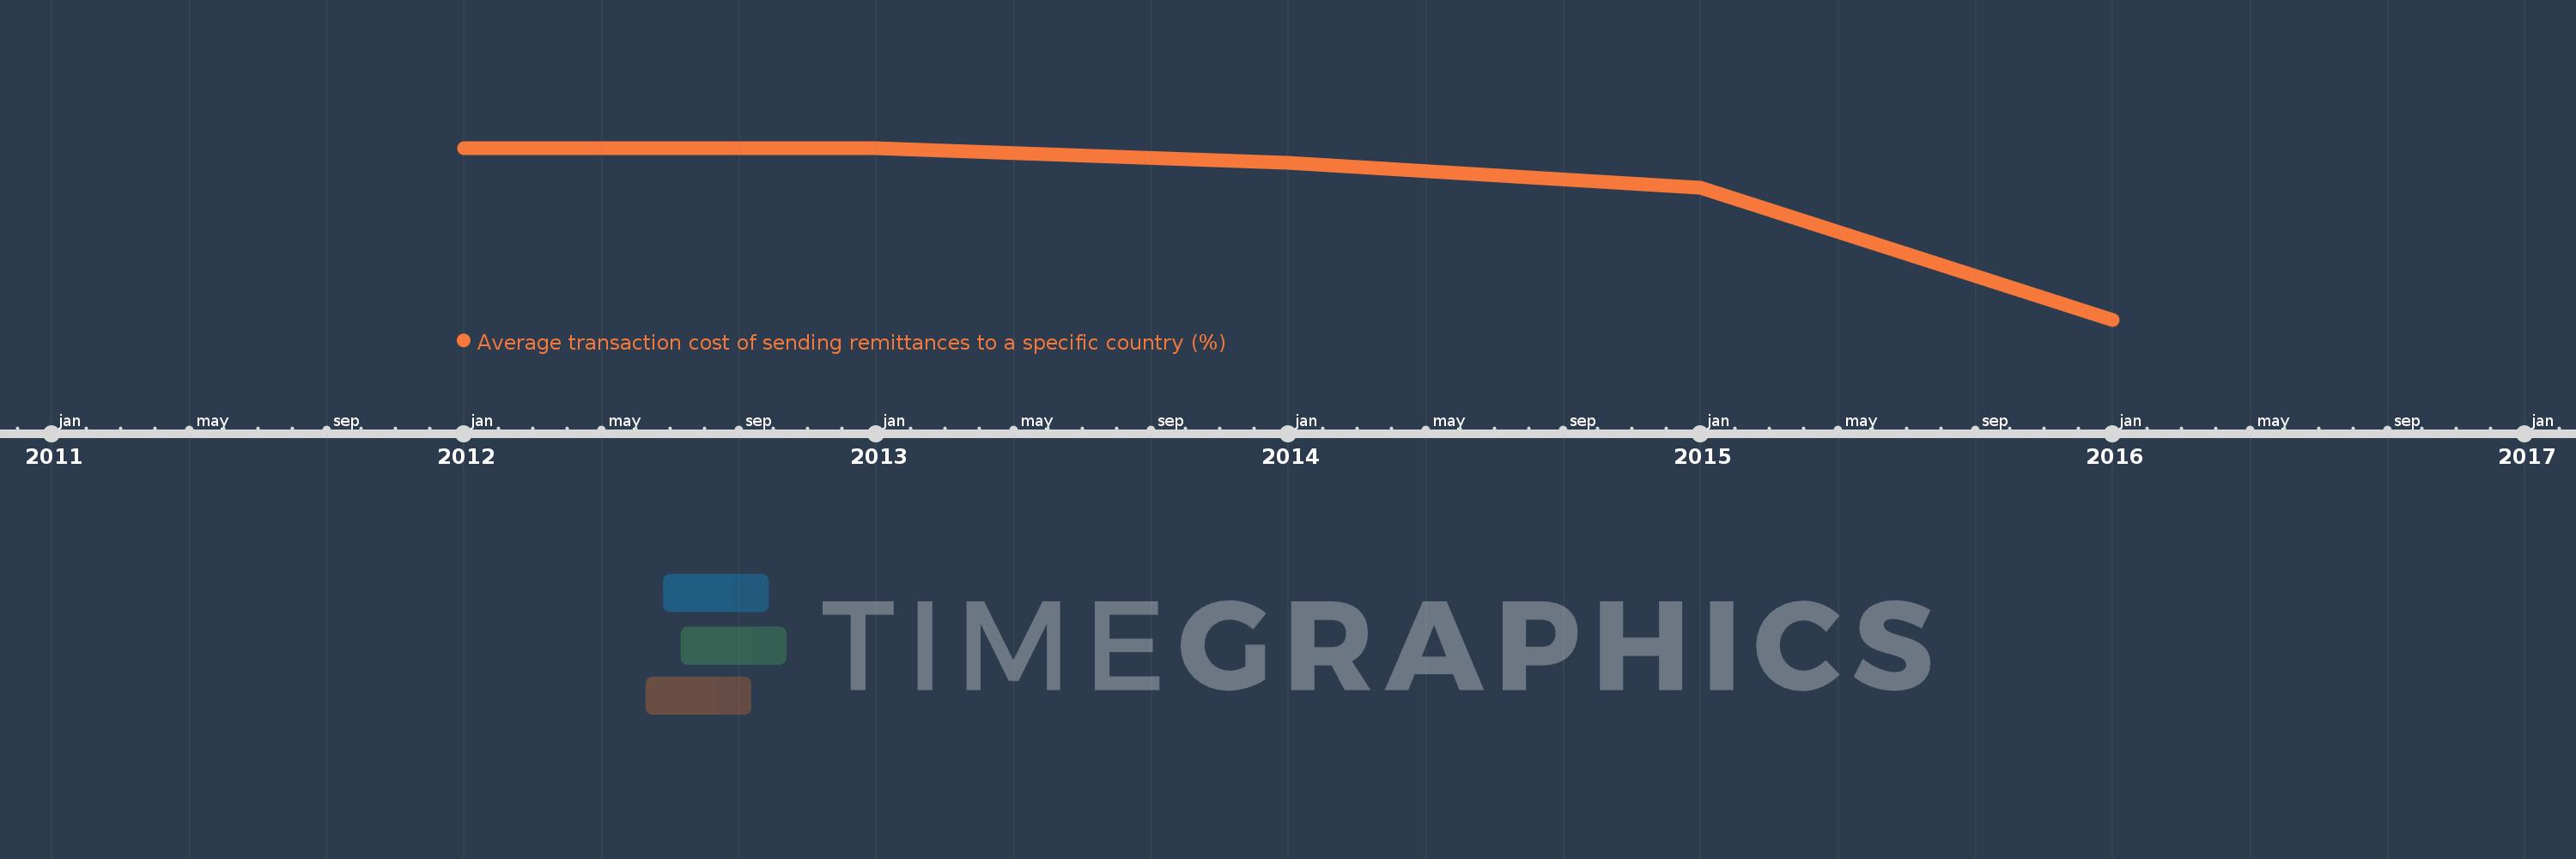
Questa scala temporale mostra un grafico dal 2012 anno al 2016 anno. Sub-Saharan Africa (excluding high income). I dati fino ad 2011 anno non disponibili. Il numero di osservazioni attuali secondo i date: 5.

La fonte (nome):

Indicatori dello sviluppo mondiale

La fonte (organizzazione):

World Bank, Remittance Prices Worldwide, available at http://remittanceprices.worldbank.org

Categorie:

Financial Sector

sono stati aggiornati

23 apr 2017 anni

Indicatori delle variazioni dei valori per anni

In media:
12.066
Minima:
10.181
1 gen 2016 anni
Massimo:
12.741
1 gen 2012 anni
Alla data di osservazione
Valore
Variazione assoluta
La variazione rispetto al valore precedente
1 gen 2012 anni
12.741
+12.741
0.0%
1 gen 2013 anni
12.734
-0.007
-0.06%
1 gen 2014 anni
12.521
-0.213
-1.67%
1 gen 2015 anni
12.154
-0.368
-2.94%
1 gen 2016 anni
10.181
-1.972
-16.23%

Classificazione dei paesi secondo i statistiche attuali per anni