29
/it/
it
AIzaSyAYiBZKx7MnpbEhh9jyipgxe19OcubqV5w
April 1, 2024
59124
Sub-Saharan Africa
SSF
false
2
1
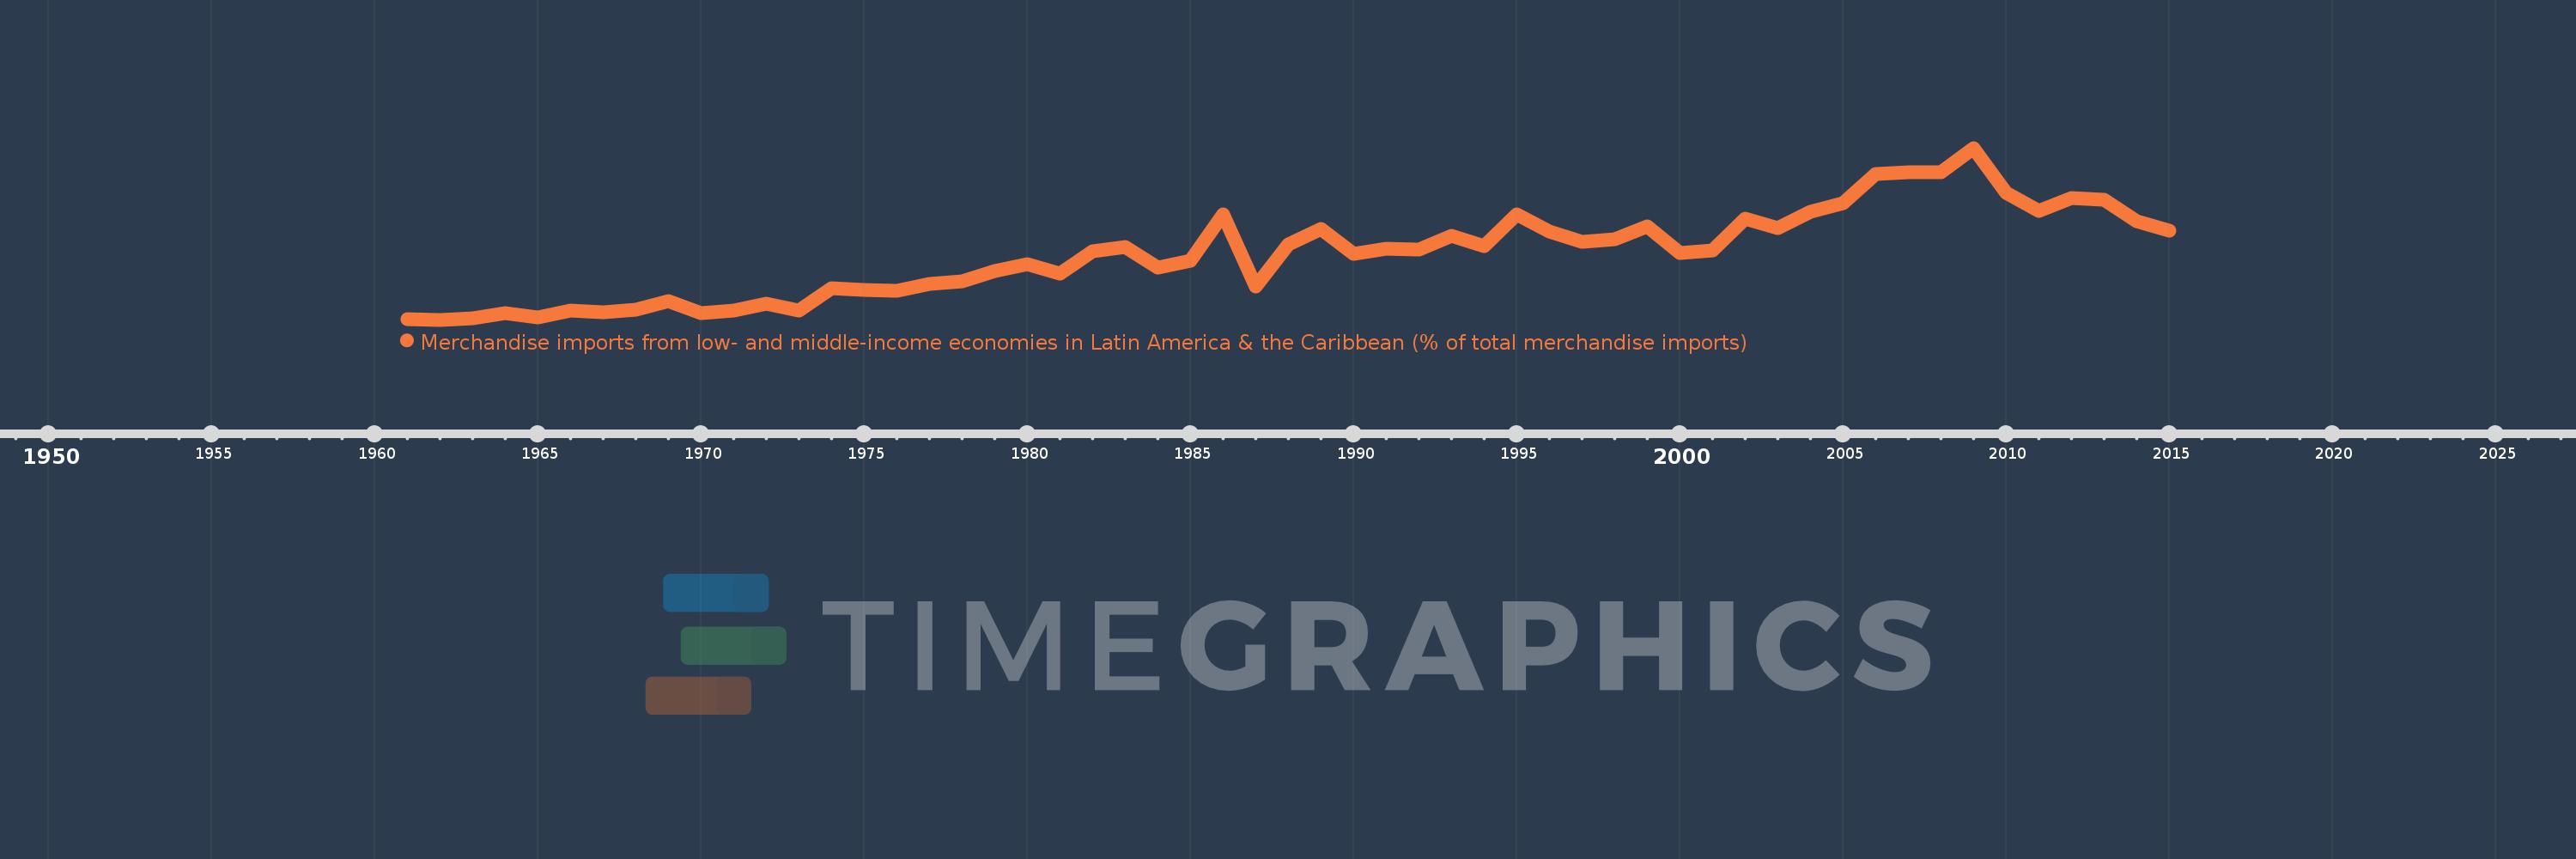
Merchandise imports from low- and middle-income economies in Latin America & the Caribbean (% of total merchandise imports)
2015,2014,2013,2012,2011,2010,2009,2008,2007,2006,2005,2004,2003,2002,2001,2000,1999,1998,1997,1996,1995,1994,1993,1992,1991,1990,1989,1988,1987,1986,1985,1984,1983,1982,1981,1980,1979,1978,1977,1976,1975,1974,1973,1972,1971,1970,1969,1968,1967,1966,1965,1964,1963,1962,1961
Queste statistiche in altri paesi:
AfghanistanAlbaniaAlgeriaAngolaAntigua and BarbudaArab WorldArgentinaArmeniaArubaAustraliaAustriaAzerbaijanBahamas, TheBahrainBangladeshBarbadosBelarusBelgiumBelizeBeninBermudaBoliviaBrazilBrunei DarussalamBulgariaBurkina FasoCabo VerdeCambodiaCameroonCanadaCaribbean small statesCentral African RepublicCentral Europe and the BalticsChileChinaColombiaCongo, Dem. Rep.Congo, Rep.Costa RicaCote d'IvoireCroatiaCubaCyprusCzech RepublicDenmarkDominicaDominican RepublicEarly-demographic dividendEast Asia & PacificEast Asia & Pacific (excluding high income)East Asia & Pacific (IDA & IBRD countries)EcuadorEgypt, Arab Rep.El SalvadorEstoniaEthiopiaEuro areaEurope & Central AsiaEurope & Central Asia (excluding high income)Europe & Central Asia (IDA & IBRD countries)European UnionFaroe IslandsFijiFinlandFragile and conflict affected situationsFranceFrench PolynesiaGabonGambia, TheGeorgiaGermanyGhanaGibraltarGreeceGreenlandGrenadaGuatemalaGuineaGuyanaHaitiHeavily indebted poor countries (HIPC)High incomeHondurasHong Kong SAR, ChinaHungaryIBRD onlyIcelandIDA & IBRD totalIDA blendIDA onlyIDA totalIndiaIndonesiaIran, Islamic Rep.IraqIrelandIsraelItalyJamaicaJapanJordanKazakhstanKenyaKorea, Dem. People’s Rep.Korea, Rep.KuwaitKyrgyz RepublicLate-demographic dividendLatin America & Caribbean Latin America & Caribbean (excluding high income)Latin America & the Caribbean (IDA & IBRD countries)LatviaLeast developed countries: UN classificationLebanonLiberiaLibyaLithuaniaLow & middle incomeLow incomeLower middle incomeLuxembourgMacao SAR, ChinaMacedonia, FYRMadagascarMalawiMalaysiaMaldivesMaliMaltaMauritaniaMauritiusMexicoMiddle East & North AfricaMiddle East & North Africa (excluding high income)Middle East & North Africa (IDA & IBRD countries)Middle incomeMoldovaMongoliaMontenegroMoroccoMozambiqueNetherlandsNew CaledoniaNew ZealandNicaraguaNigerNigeriaNorth AmericaNorwayOECD membersOmanOther small statesPacific island small statesPakistanPanamaPapua New GuineaParaguayPeruPhilippinesPolandPortugalPost-demographic dividendPre-demographic dividendQatarRomaniaRussian FederationSaudi ArabiaSenegalSerbiaSierra LeoneSingaporeSlovak RepublicSloveniaSmall statesSomaliaSouth AfricaSouth AsiaSouth Asia (IDA & IBRD)SpainSri LankaSt. Kitts and NevisSt. LuciaSt. Vincent and the GrenadinesSub-Saharan Africa Sub-Saharan Africa (excluding high income)Sub-Saharan Africa (IDA & IBRD countries)SudanSurinameSwedenSwitzerlandSyrian Arab RepublicTanzaniaThailandTogoTrinidad and TobagoTunisiaTurkeyUgandaUkraineUnited Arab EmiratesUnited KingdomUnited StatesUpper middle incomeUruguayVenezuela, RBVietnamWorldYemen, Rep.ZambiaZimbabwe Linea del tempo:
Questa scala temporale mostra un grafico dal 1961 anno al 2015 anno. Sub-Saharan Africa . I dati fino ad 1960 anno non disponibili. Il numero di osservazioni attuali secondo i date: 55.
La fonte (nome):
Indicatori dello sviluppo mondiale
La fonte (organizzazione):
World Bank staff estimates based data from International Monetary Fund's Direction of Trade database.
Categorie:
Private Sector, Trade
sono stati aggiornati
23 apr 2017 anni
Indicatori delle variazioni dei valori per anni
Minima:
0.021
1 gen 1962 anni
Massimo:
3.365
1 gen 2009 anni
Alla data di osservazione
Valore
Variazione assoluta
La variazione rispetto al valore precedente
1 gen 1961 anni
0.039
+0.039
0.0%
1 gen 1962 anni
0.021
-0.017
-44.85%
1 gen 1963 anni
0.055
+0.034
157.79%
1 gen 1964 anni
0.153
+0.098
178.24%
1 gen 1965 anni
0.074
-0.079
-51.86%
1 gen 1966 anni
0.206
+0.132
179.4%
1 gen 1967 anni
0.171
-0.035
-17.2%
1 gen 1968 anni
0.216
+0.045
26.59%
1 gen 1969 anni
0.389
+0.173
80.1%
1 gen 1970 anni
0.151
-0.238
-61.24%
1 gen 1971 anni
0.196
+0.045
29.74%
1 gen 1972 anni
0.327
+0.132
67.29%
1 gen 1973 anni
0.198
-0.13
-39.62%
1 gen 1974 anni
0.632
+0.435
220.21%
1 gen 1975 anni
0.594
-0.038
-6.01%
1 gen 1976 anni
0.585
-0.01
-1.64%
1 gen 1977 anni
0.72
+0.135
23.15%
1 gen 1978 anni
0.763
+0.043
5.96%
1 gen 1979 anni
0.967
+0.204
26.76%
1 gen 1980 anni
1.104
+0.138
14.22%
1 gen 1981 anni
0.918
-0.187
-16.89%
1 gen 1982 anni
1.347
+0.429
46.73%
1 gen 1983 anni
1.435
+0.088
6.56%
1 gen 1984 anni
1.041
-0.395
-27.5%
1 gen 1985 anni
1.176
+0.136
13.05%
1 gen 1986 anni
2.079
+0.903
76.73%
1 gen 1987 anni
0.669
-1.41
-67.84%
1 gen 1988 anni
1.484
+0.815
121.93%
1 gen 1989 anni
1.782
+0.298
20.05%
1 gen 1990 anni
1.302
-0.48
-26.93%
1 gen 1991 anni
1.405
+0.103
7.94%
1 gen 1992 anni
1.382
-0.024
-1.68%
1 gen 1993 anni
1.653
+0.271
19.63%
1 gen 1994 anni
1.446
-0.207
-12.52%
1 gen 1995 anni
2.08
+0.634
43.84%
1 gen 1996 anni
1.739
-0.341
-16.4%
1 gen 1997 anni
1.537
-0.202
-11.6%
1 gen 1998 anni
1.589
+0.052
3.37%
1 gen 1999 anni
1.845
+0.256
16.14%
1 gen 2000 anni
1.32
-0.525
-28.43%
1 gen 2001 anni
1.368
+0.048
3.62%
1 gen 2002 anni
1.984
+0.616
45.01%
1 gen 2003 anni
1.813
-0.171
-8.61%
1 gen 2004 anni
2.13
+0.317
17.49%
1 gen 2005 anni
2.284
+0.154
7.23%
1 gen 2006 anni
2.856
+0.571
25.01%
1 gen 2007 anni
2.893
+0.037
1.31%
1 gen 2008 anni
2.889
-0.004
-0.14%
1 gen 2009 anni
3.365
+0.476
16.47%
1 gen 2010 anni
2.496
-0.869
-25.83%
1 gen 2011 anni
2.143
-0.353
-14.14%
1 gen 2012 anni
2.392
+0.249
11.62%
1 gen 2013 anni
2.36
-0.031
-1.32%
1 gen 2014 anni
1.946
-0.415
-17.57%
1 gen 2015 anni
1.747
-0.199
-10.21%
Classificazione dei paesi secondo i statistiche attuali per anni


Commenti: