29
/it/
it
AIzaSyAYiBZKx7MnpbEhh9jyipgxe19OcubqV5w
April 1, 2024
58320
South Asia (IDA & IBRD)
TSA
false
2
1
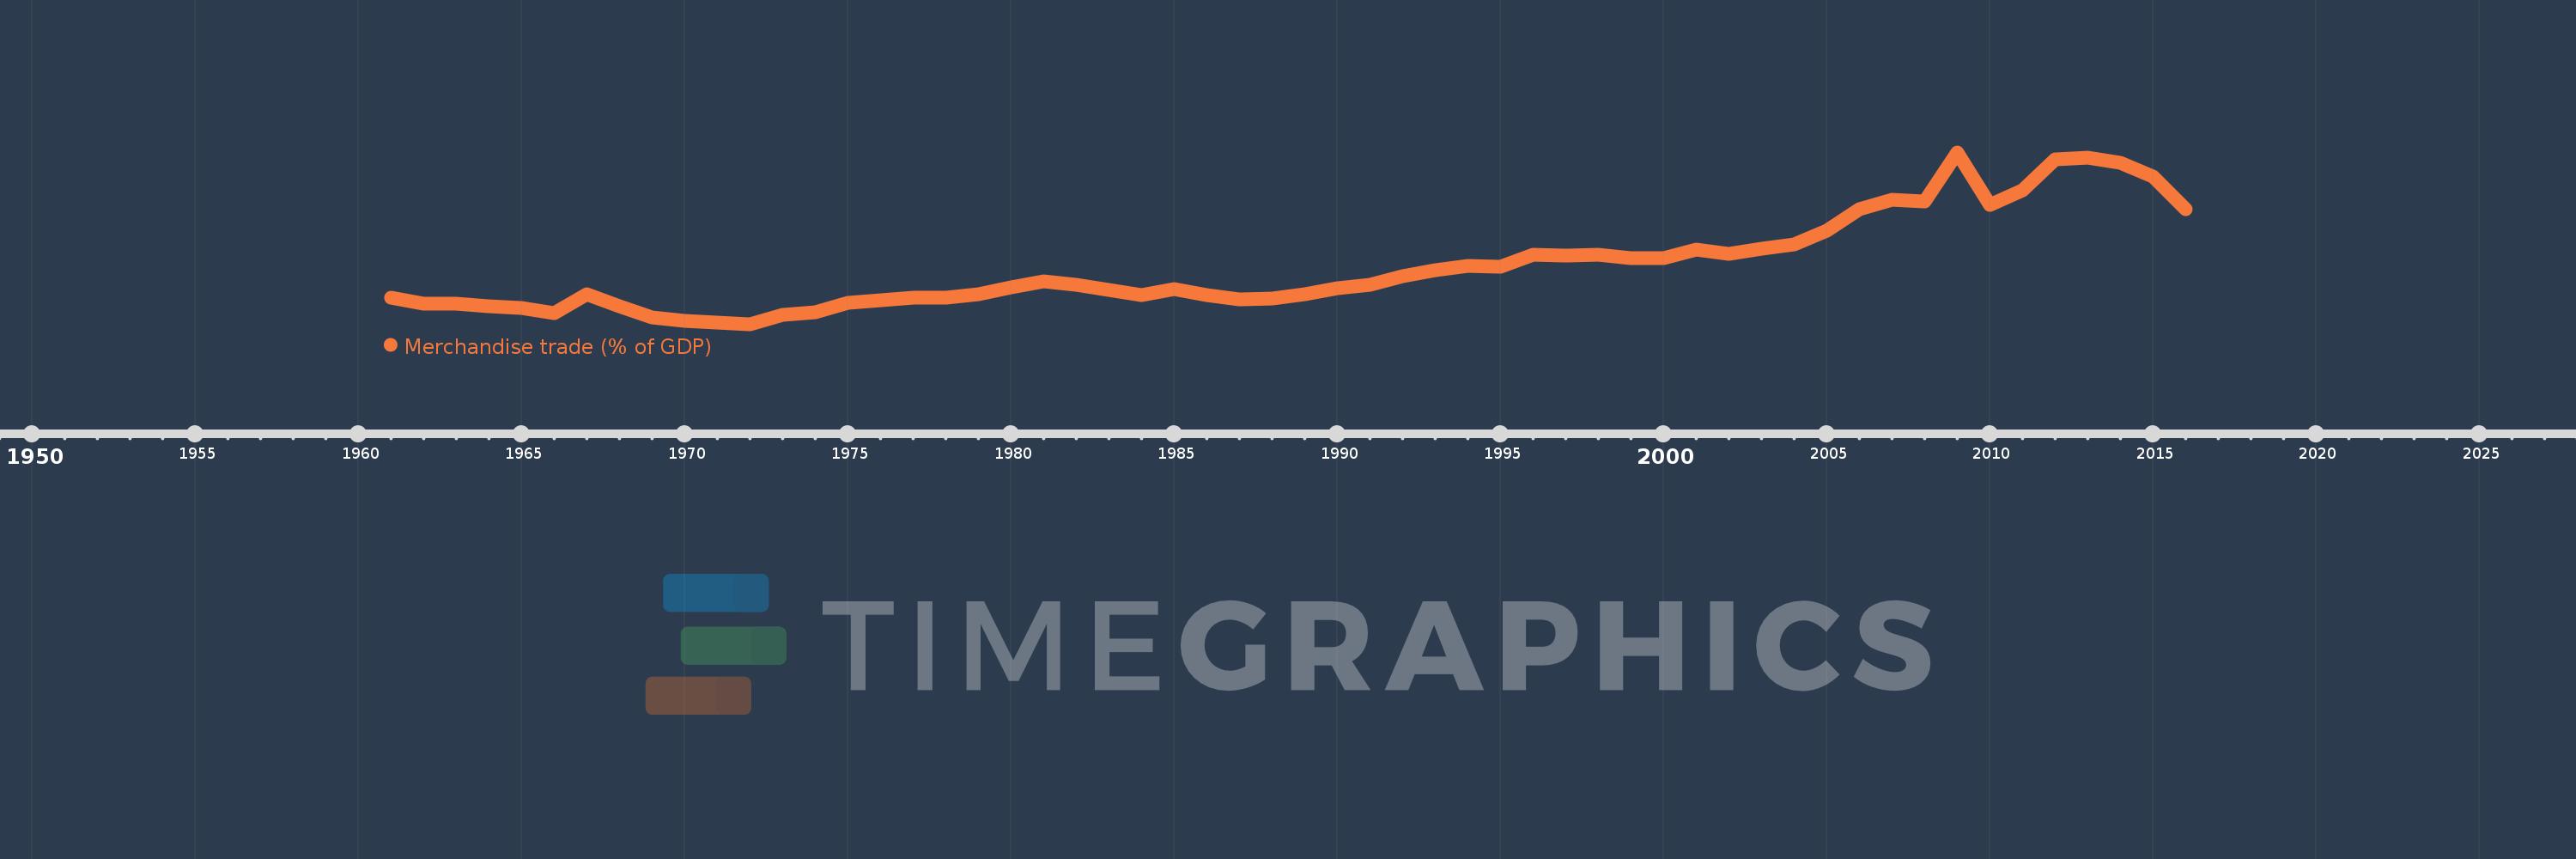
Merchandise trade (% of GDP)
2016,2015,2014,2013,2012,2011,2010,2009,2008,2007,2006,2005,2004,2003,2002,2001,2000,1999,1998,1997,1996,1995,1994,1993,1992,1991,1990,1989,1988,1987,1986,1985,1984,1983,1982,1981,1980,1979,1978,1977,1976,1975,1974,1973,1972,1971,1970,1969,1968,1967,1966,1965,1964,1963,1962,1961
Queste statistiche in altri paesi:
AfghanistanAlbaniaAlgeriaAngolaAntigua and BarbudaArab WorldArgentinaArmeniaArubaAustraliaAustriaAzerbaijanBahamas, TheBahrainBangladeshBarbadosBelarusBelgiumBelizeBeninBermudaBhutanBoliviaBosnia and HerzegovinaBotswanaBrazilBrunei DarussalamBulgariaBurkina FasoBurundiCabo VerdeCambodiaCameroonCanadaCaribbean small statesCentral African RepublicCentral Europe and the BalticsChadChileChinaColombiaComorosCongo, Dem. Rep.Congo, Rep.Costa RicaCote d'IvoireCroatiaCubaCyprusCzech RepublicDenmarkDjiboutiDominicaDominican RepublicEarly-demographic dividendEast Asia & PacificEast Asia & Pacific (excluding high income)East Asia & Pacific (IDA & IBRD countries)EcuadorEgypt, Arab Rep.El SalvadorEquatorial GuineaEritreaEstoniaEthiopiaEuro areaEurope & Central AsiaEurope & Central Asia (excluding high income)Europe & Central Asia (IDA & IBRD countries)European UnionFaroe IslandsFijiFinlandFragile and conflict affected situationsFranceFrench PolynesiaGabonGambia, TheGeorgiaGermanyGhanaGreeceGreenlandGrenadaGuatemalaGuineaGuinea-BissauGuyanaHaitiHeavily indebted poor countries (HIPC)High incomeHondurasHong Kong SAR, ChinaHungaryIBRD onlyIcelandIDA & IBRD totalIDA blendIDA onlyIDA totalIndiaIndonesiaIran, Islamic Rep.IraqIrelandIsraelItalyJamaicaJapanJordanKazakhstanKenyaKiribatiKorea, Rep.KuwaitKyrgyz RepublicLao PDRLate-demographic dividendLatin America & Caribbean Latin America & Caribbean (excluding high income)Latin America & the Caribbean (IDA & IBRD countries)LatviaLeast developed countries: UN classificationLebanonLesothoLiberiaLibyaLithuaniaLow & middle incomeLow incomeLower middle incomeLuxembourgMacao SAR, ChinaMacedonia, FYRMadagascarMalawiMalaysiaMaldivesMaliMaltaMarshall IslandsMauritaniaMauritiusMexicoMicronesia, Fed. Sts.Middle East & North AfricaMiddle East & North Africa (excluding high income)Middle East & North Africa (IDA & IBRD countries)Middle incomeMoldovaMongoliaMontenegroMoroccoMozambiqueMyanmarNamibiaNepalNetherlandsNew CaledoniaNew ZealandNicaraguaNigerNigeriaNorth AmericaNorwayOECD membersOmanOther small statesPacific island small statesPakistanPalauPanamaPapua New GuineaParaguayPeruPhilippinesPolandPortugalPost-demographic dividendPre-demographic dividendQatarRomaniaRussian FederationRwandaSamoaSao Tome and PrincipeSaudi ArabiaSenegalSerbiaSeychellesSierra LeoneSingaporeSlovak RepublicSloveniaSmall statesSolomon IslandsSouth AfricaSouth AsiaSouth Asia (IDA & IBRD)SpainSri LankaSt. Kitts and NevisSt. LuciaSt. Vincent and the GrenadinesSub-Saharan Africa Sub-Saharan Africa (excluding high income)Sub-Saharan Africa (IDA & IBRD countries)SudanSurinameSwazilandSwedenSwitzerlandSyrian Arab RepublicTajikistanTanzaniaThailandTimor-LesteTogoTongaTrinidad and TobagoTunisiaTurkeyTurkmenistanTuvaluUgandaUkraineUnited Arab EmiratesUnited KingdomUnited StatesUpper middle incomeUruguayUzbekistanVanuatuVenezuela, RBVietnamWorldYemen, Rep.ZambiaZimbabwe Linea del tempo:
Questa scala temporale mostra un grafico dal 1961 anno al 2016 anno. South Asia (IDA & IBRD). I dati fino ad 1960 anno non disponibili. Il numero di osservazioni attuali secondo i date: 56.
La fonte (nome):
Indicatori dello sviluppo mondiale
La fonte (organizzazione):
World Trade Organization, and World Bank GDP estimates.
Categorie:
Private Sector, Trade
sono stati aggiornati
23 apr 2017 anni
Indicatori delle variazioni dei valori per anni
Minima:
7.873
1 gen 1972 anni
Massimo:
42.959
1 gen 2009 anni
Alla data di osservazione
Valore
Variazione assoluta
La variazione rispetto al valore precedente
1 gen 1961 anni
13.376
+13.376
0.0%
1 gen 1962 anni
12.138
-1.238
-9.25%
1 gen 1963 anni
12.03
-0.108
-0.89%
1 gen 1964 anni
11.515
-0.516
-4.29%
1 gen 1965 anni
11.13
-0.385
-3.34%
1 gen 1966 anni
10.186
-0.945
-8.49%
1 gen 1967 anni
14.028
+3.842
37.72%
1 gen 1968 anni
11.454
-2.573
-18.34%
1 gen 1969 anni
9.308
-2.147
-18.74%
1 gen 1970 anni
8.552
-0.756
-8.12%
1 gen 1971 anni
8.182
-0.37
-4.32%
1 gen 1972 anni
7.873
-0.31
-3.79%
1 gen 1973 anni
9.71
+1.837
23.34%
1 gen 1974 anni
10.261
+0.551
5.68%
1 gen 1975 anni
12.206
+1.945
18.96%
1 gen 1976 anni
12.842
+0.636
5.21%
1 gen 1977 anni
13.3
+0.458
3.57%
1 gen 1978 anni
13.267
-0.033
-0.25%
1 gen 1979 anni
13.97
+0.703
5.3%
1 gen 1980 anni
15.438
+1.468
10.5%
1 gen 1981 anni
16.549
+1.111
7.19%
1 gen 1982 anni
15.993
-0.556
-3.36%
1 gen 1983 anni
14.844
-1.149
-7.18%
1 gen 1984 anni
13.795
-1.049
-7.07%
1 gen 1985 anni
15.073
+1.278
9.27%
1 gen 1986 anni
13.773
-1.3
-8.62%
1 gen 1987 anni
12.909
-0.864
-6.27%
1 gen 1988 anni
13.125
+0.216
1.67%
1 gen 1989 anni
13.994
+0.868
6.61%
1 gen 1990 anni
15.21
+1.217
8.7%
1 gen 1991 anni
16.011
+0.8
5.26%
1 gen 1992 anni
17.751
+1.74
10.87%
1 gen 1993 anni
18.943
+1.192
6.71%
1 gen 1994 anni
19.745
+0.802
4.23%
1 gen 1995 anni
19.692
-0.052
-0.27%
1 gen 1996 anni
22.02
+2.328
11.82%
1 gen 1997 anni
21.904
-0.117
-0.53%
1 gen 1998 anni
22.036
+0.132
0.6%
1 gen 1999 anni
21.334
-0.702
-3.18%
1 gen 2000 anni
21.313
-0.022
-0.1%
1 gen 2001 anni
23.105
+1.792
8.41%
1 gen 2002 anni
22.273
-0.832
-3.6%
1 gen 2003 anni
23.239
+0.966
4.34%
1 gen 2004 anni
24.126
+0.887
3.82%
1 gen 2005 anni
27.009
+2.883
11.95%
1 gen 2006 anni
31.294
+4.285
15.86%
1 gen 2007 anni
33.232
+1.938
6.19%
1 gen 2008 anni
32.921
-0.311
-0.94%
1 gen 2009 anni
42.959
+10.038
30.49%
1 gen 2010 anni
32.228
-10.731
-24.98%
1 gen 2011 anni
35.226
+2.997
9.3%
1 gen 2012 anni
41.603
+6.377
18.1%
1 gen 2013 anni
41.88
+0.278
0.67%
1 gen 2014 anni
40.826
-1.054
-2.52%
1 gen 2015 anni
37.975
-2.851
-6.98%
1 gen 2016 anni
31.373
-6.602
-17.38%
Classificazione dei paesi secondo i statistiche attuali per anni


Commenti: