29
/it/
it
AIzaSyAYiBZKx7MnpbEhh9jyipgxe19OcubqV5w
April 1, 2024
58267
South Asia (IDA & IBRD)
TSA
false
2
1
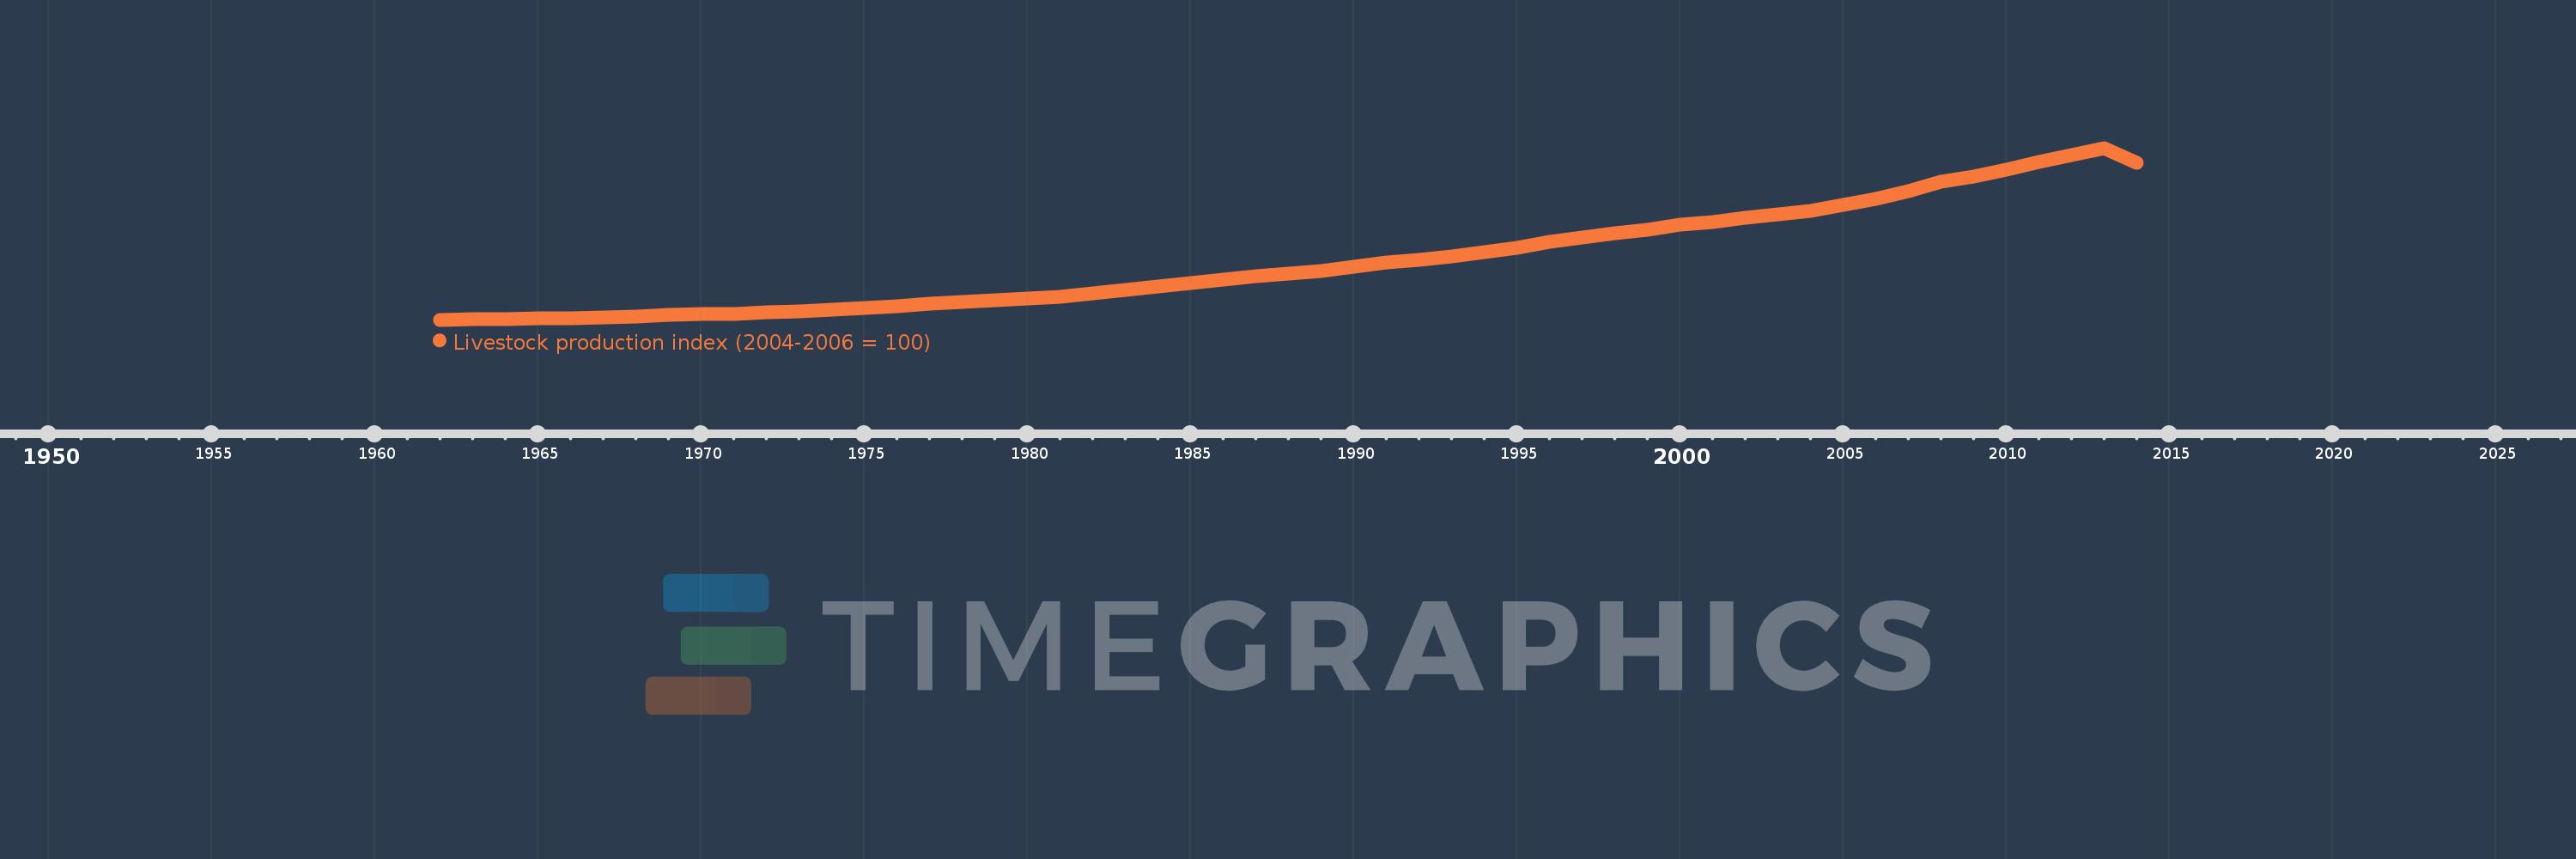
Livestock production index (2004-2006 = 100)
2014,2013,2012,2011,2010,2009,2008,2007,2006,2005,2004,2003,2002,2001,2000,1999,1998,1997,1996,1995,1994,1993,1992,1991,1990,1989,1988,1987,1986,1985,1984,1983,1982,1981,1980,1979,1978,1977,1976,1975,1974,1973,1972,1971,1970,1969,1968,1967,1966,1965,1964,1963,1962
Queste statistiche in altri paesi:
AfghanistanAlbaniaAlgeriaAmerican SamoaAngolaAntigua and BarbudaArab WorldArgentinaArmeniaAustraliaAustriaAzerbaijanBahamas, TheBahrainBangladeshBarbadosBelarusBelgiumBelizeBeninBermudaBhutanBoliviaBosnia and HerzegovinaBotswanaBrazilBritish Virgin IslandsBrunei DarussalamBulgariaBurkina FasoBurundiCabo VerdeCambodiaCameroonCanadaCaribbean small statesCayman IslandsCentral African RepublicCentral Europe and the BalticsChadChileChinaColombiaComorosCongo, Dem. Rep.Congo, Rep.Costa RicaCote d'IvoireCroatiaCubaCyprusCzech RepublicDenmarkDjiboutiDominicaDominican RepublicEarly-demographic dividendEast Asia & PacificEast Asia & Pacific (excluding high income)East Asia & Pacific (IDA & IBRD countries)EcuadorEgypt, Arab Rep.El SalvadorEquatorial GuineaEritreaEstoniaEthiopiaEuro areaEurope & Central AsiaEurope & Central Asia (excluding high income)Europe & Central Asia (IDA & IBRD countries)European UnionFaroe IslandsFijiFinlandFragile and conflict affected situationsFranceFrench PolynesiaGabonGambia, TheGeorgiaGermanyGhanaGreeceGreenlandGrenadaGuamGuatemalaGuineaGuinea-BissauGuyanaHaitiHeavily indebted poor countries (HIPC)High incomeHondurasHong Kong SAR, ChinaHungaryIBRD onlyIcelandIDA & IBRD totalIDA blendIDA onlyIDA totalIndiaIndonesiaIran, Islamic Rep.IraqIrelandIsraelItalyJamaicaJapanJordanKazakhstanKenyaKiribatiKorea, Dem. People’s Rep.Korea, Rep.KuwaitKyrgyz RepublicLao PDRLate-demographic dividendLatin America & Caribbean Latin America & Caribbean (excluding high income)Latin America & the Caribbean (IDA & IBRD countries)LatviaLeast developed countries: UN classificationLebanonLesothoLiberiaLibyaLiechtensteinLithuaniaLow & middle incomeLow incomeLower middle incomeLuxembourgMacao SAR, ChinaMacedonia, FYRMadagascarMalawiMalaysiaMaldivesMaliMaltaMauritaniaMauritiusMexicoMicronesia, Fed. Sts.Middle East & North AfricaMiddle East & North Africa (excluding high income)Middle East & North Africa (IDA & IBRD countries)Middle incomeMoldovaMongoliaMontenegroMoroccoMozambiqueMyanmarNamibiaNauruNepalNetherlandsNew CaledoniaNew ZealandNicaraguaNigerNigeriaNorth AmericaNorwayOECD membersOmanOther small statesPacific island small statesPakistanPanamaPapua New GuineaParaguayPeruPhilippinesPolandPortugalPost-demographic dividendPre-demographic dividendPuerto RicoQatarRomaniaRussian FederationRwandaSamoaSao Tome and PrincipeSaudi ArabiaSenegalSerbiaSeychellesSierra LeoneSingaporeSlovak RepublicSloveniaSmall statesSolomon IslandsSomaliaSouth AfricaSouth AsiaSouth Asia (IDA & IBRD)SpainSri LankaSt. Kitts and NevisSt. LuciaSt. Vincent and the GrenadinesSub-Saharan Africa Sub-Saharan Africa (excluding high income)Sub-Saharan Africa (IDA & IBRD countries)SudanSurinameSwazilandSwedenSwitzerlandSyrian Arab RepublicTajikistanTanzaniaThailandTimor-LesteTogoTongaTrinidad and TobagoTunisiaTurkeyTurkmenistanTuvaluUgandaUkraineUnited Arab EmiratesUnited KingdomUnited StatesUpper middle incomeUruguayUzbekistanVanuatuVenezuela, RBVietnamVirgin Islands (U.S.)West Bank and GazaWorldYemen, Rep.ZambiaZimbabwe Linea del tempo:
Questa scala temporale mostra un grafico dal 1962 anno al 2014 anno. South Asia (IDA & IBRD). I dati fino ad 1961 anno non disponibili. Il numero di osservazioni attuali secondo i date: 53.
La fonte (nome):
Indicatori dello sviluppo mondiale
La fonte (organizzazione):
Food and Agriculture Organization, electronic files and web site.
Categorie:
Agriculture & Rural Development
sono stati aggiornati
23 apr 2017 anni
Indicatori delle variazioni dei valori per anni
Minima:
24.267
1 gen 1962 anni
Massimo:
131.438
1 gen 2013 anni
Alla data di osservazione
Valore
Variazione assoluta
La variazione rispetto al valore precedente
1 gen 1962 anni
24.267
+24.267
0.0%
1 gen 1963 anni
24.572
+0.305
1.26%
1 gen 1964 anni
24.879
+0.307
1.25%
1 gen 1965 anni
25.102
+0.224
0.9%
1 gen 1966 anni
25.397
+0.295
1.17%
1 gen 1967 anni
25.8
+0.403
1.59%
1 gen 1968 anni
26.356
+0.556
2.16%
1 gen 1969 anni
27.503
+1.147
4.35%
1 gen 1970 anni
28.051
+0.548
1.99%
1 gen 1971 anni
27.967
-0.084
-0.3%
1 gen 1972 anni
29.182
+1.215
4.34%
1 gen 1973 anni
29.547
+0.366
1.25%
1 gen 1974 anni
30.281
+0.734
2.48%
1 gen 1975 anni
31.448
+1.167
3.85%
1 gen 1976 anni
32.549
+1.101
3.5%
1 gen 1977 anni
34.101
+1.552
4.77%
1 gen 1978 anni
35.22
+1.119
3.28%
1 gen 1979 anni
36.193
+0.972
2.76%
1 gen 1980 anni
37.581
+1.389
3.84%
1 gen 1981 anni
38.45
+0.868
2.31%
1 gen 1982 anni
40.526
+2.077
5.4%
1 gen 1983 anni
42.629
+2.103
5.19%
1 gen 1984 anni
44.852
+2.223
5.21%
1 gen 1985 anni
46.962
+2.11
4.7%
1 gen 1986 anni
49.296
+2.335
4.97%
1 gen 1987 anni
51.304
+2.008
4.07%
1 gen 1988 anni
52.927
+1.623
3.16%
1 gen 1989 anni
54.911
+1.984
3.75%
1 gen 1990 anni
57.549
+2.638
4.8%
1 gen 1991 anni
60.016
+2.467
4.29%
1 gen 1992 anni
61.382
+1.366
2.28%
1 gen 1993 anni
63.724
+2.343
3.82%
1 gen 1994 anni
66.46
+2.735
4.29%
1 gen 1995 anni
69.293
+2.833
4.26%
1 gen 1996 anni
72.877
+3.584
5.17%
1 gen 1997 anni
75.39
+2.513
3.45%
1 gen 1998 anni
78.106
+2.716
3.6%
1 gen 1999 anni
80.346
+2.24
2.87%
1 gen 2000 anni
83.508
+3.162
3.94%
1 gen 2001 anni
85.19
+1.682
2.01%
1 gen 2002 anni
87.71
+2.521
2.96%
1 gen 2003 anni
90.038
+2.328
2.65%
1 gen 2004 anni
92.203
+2.165
2.4%
1 gen 2005 anni
95.981
+3.778
4.1%
1 gen 2006 anni
99.606
+3.625
3.78%
1 gen 2007 anni
104.414
+4.808
4.83%
1 gen 2008 anni
110.139
+5.725
5.48%
1 gen 2009 anni
113.728
+3.589
3.26%
1 gen 2010 anni
117.652
+3.924
3.45%
1 gen 2011 anni
122.591
+4.938
4.2%
1 gen 2012 anni
127.105
+4.514
3.68%
1 gen 2013 anni
131.438
+4.333
3.41%
1 gen 2014 anni
121.918
-9.52
-7.24%
Classificazione dei paesi secondo i statistiche attuali per anni


Commenti: