29
/it/
it
AIzaSyAYiBZKx7MnpbEhh9jyipgxe19OcubqV5w
April 1, 2024
56629
Small states
SST
false
2
1
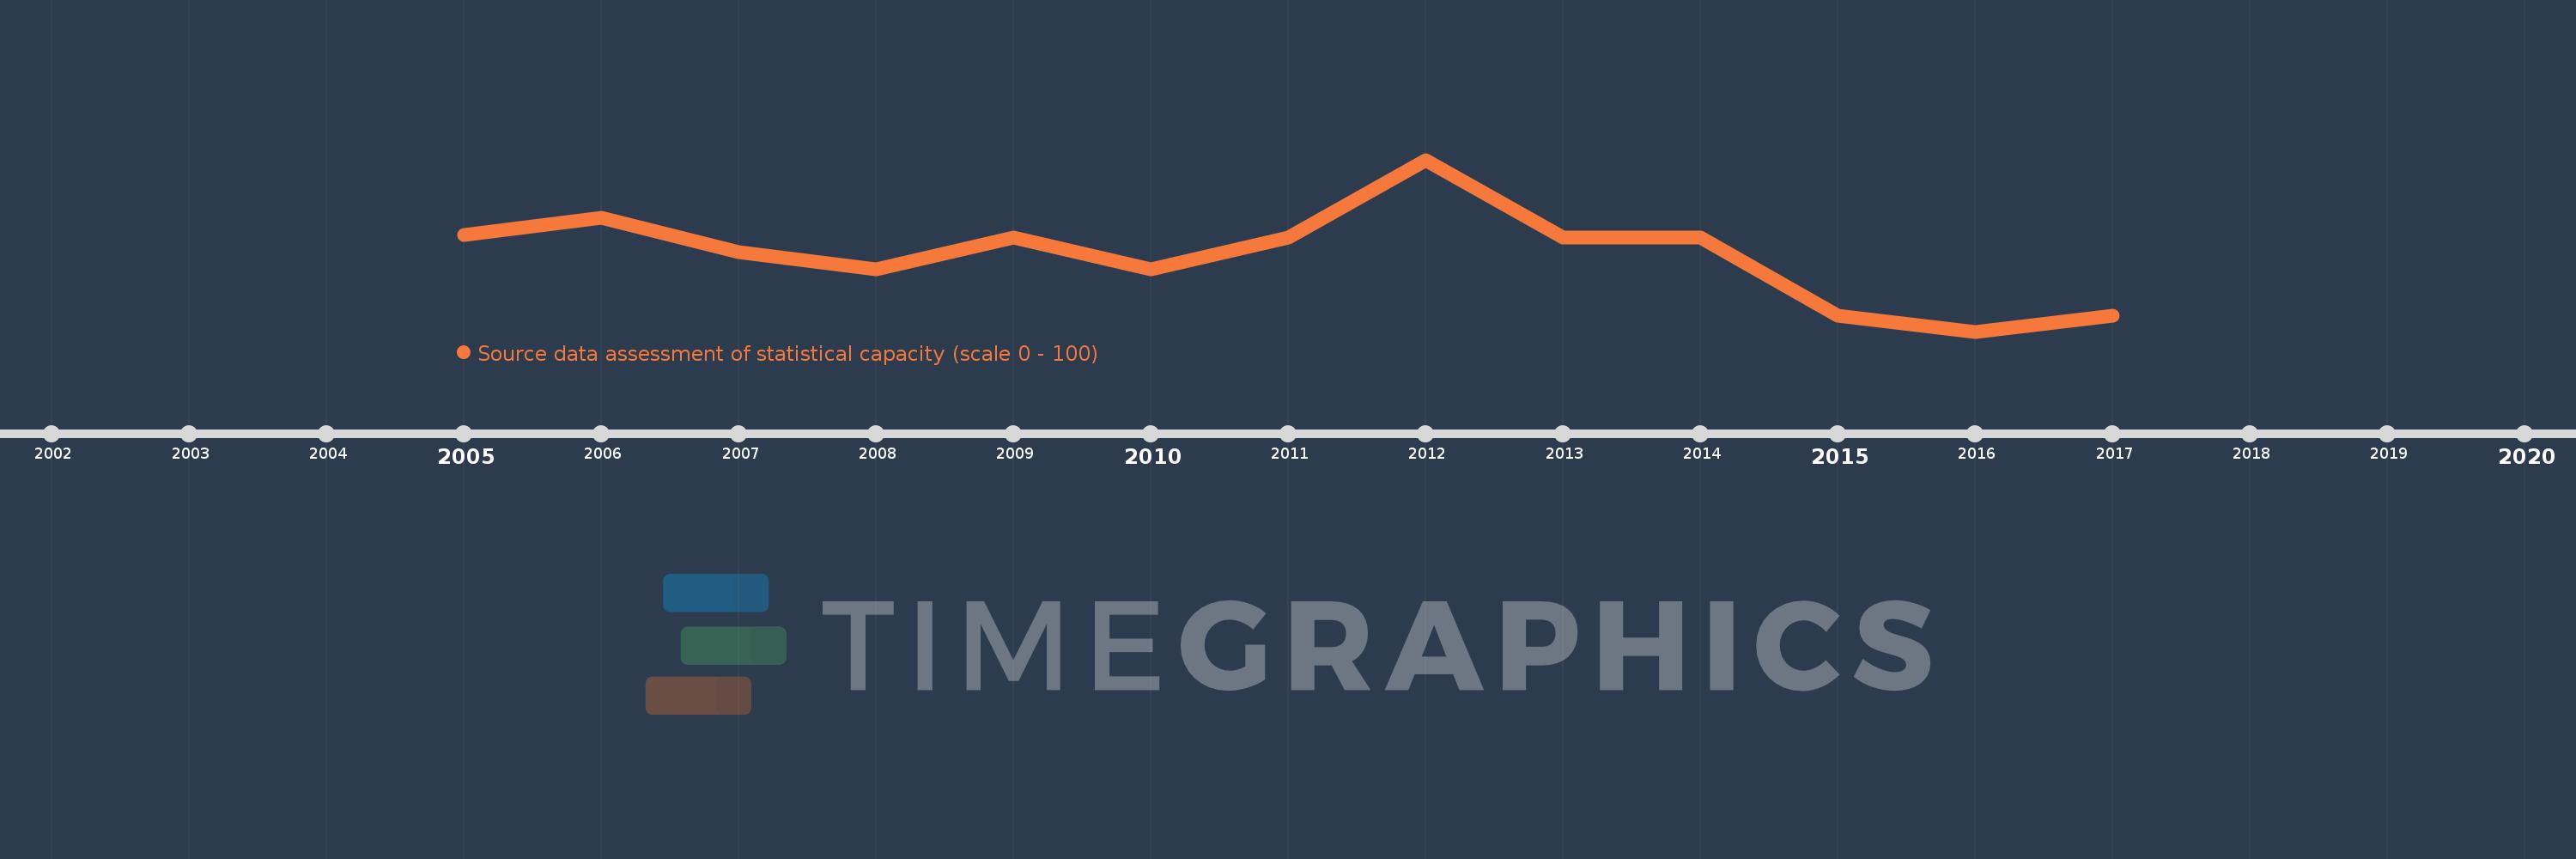
Source data assessment of statistical capacity (scale 0 - 100)
2017,2016,2015,2014,2013,2012,2011,2010,2009,2008,2007,2006,2005
Queste statistiche in altri paesi:
Linea del tempo:
Questa scala temporale mostra un grafico dal 2005 anno al 2017 anno. Small states. I dati fino ad 2004 anno non disponibili. Il numero di osservazioni attuali secondo i date: 13.
La fonte (nome):
Indicatori dello sviluppo mondiale
La fonte (organizzazione):
World Bank
Categorie:
Public Sector
sono stati aggiornati
23 apr 2017 anni
Indicatori delle variazioni dei valori per anni
Minima:
56.364
1 gen 2016 anni
Massimo:
66.364
1 gen 2012 anni
Alla data di osservazione
Valore
Variazione assoluta
La variazione rispetto al valore precedente
1 gen 2005 anni
62.0
+62.0
0.0%
1 gen 2006 anni
63.0
+1.0
1.61%
1 gen 2007 anni
61.0
-2.0
-3.17%
1 gen 2008 anni
60.0
-1.0
-1.64%
1 gen 2009 anni
61.818
+1.818
3.03%
1 gen 2010 anni
60.0
-1.818
-2.94%
1 gen 2011 anni
61.818
+1.818
3.03%
1 gen 2012 anni
66.364
+4.545
7.35%
1 gen 2013 anni
61.818
-4.545
-6.85%
1 gen 2014 anni
61.818
0.0
0.0%
1 gen 2015 anni
57.273
-4.545
-7.35%
1 gen 2016 anni
56.364
-0.909
-1.59%
1 gen 2017 anni
57.273
+0.909
1.61%
Classificazione dei paesi secondo i statistiche attuali per anni


Commenti: