29
/it/
it
AIzaSyAYiBZKx7MnpbEhh9jyipgxe19OcubqV5w
April 1, 2024
55946
Pre-demographic dividend
PRE
false
2
1
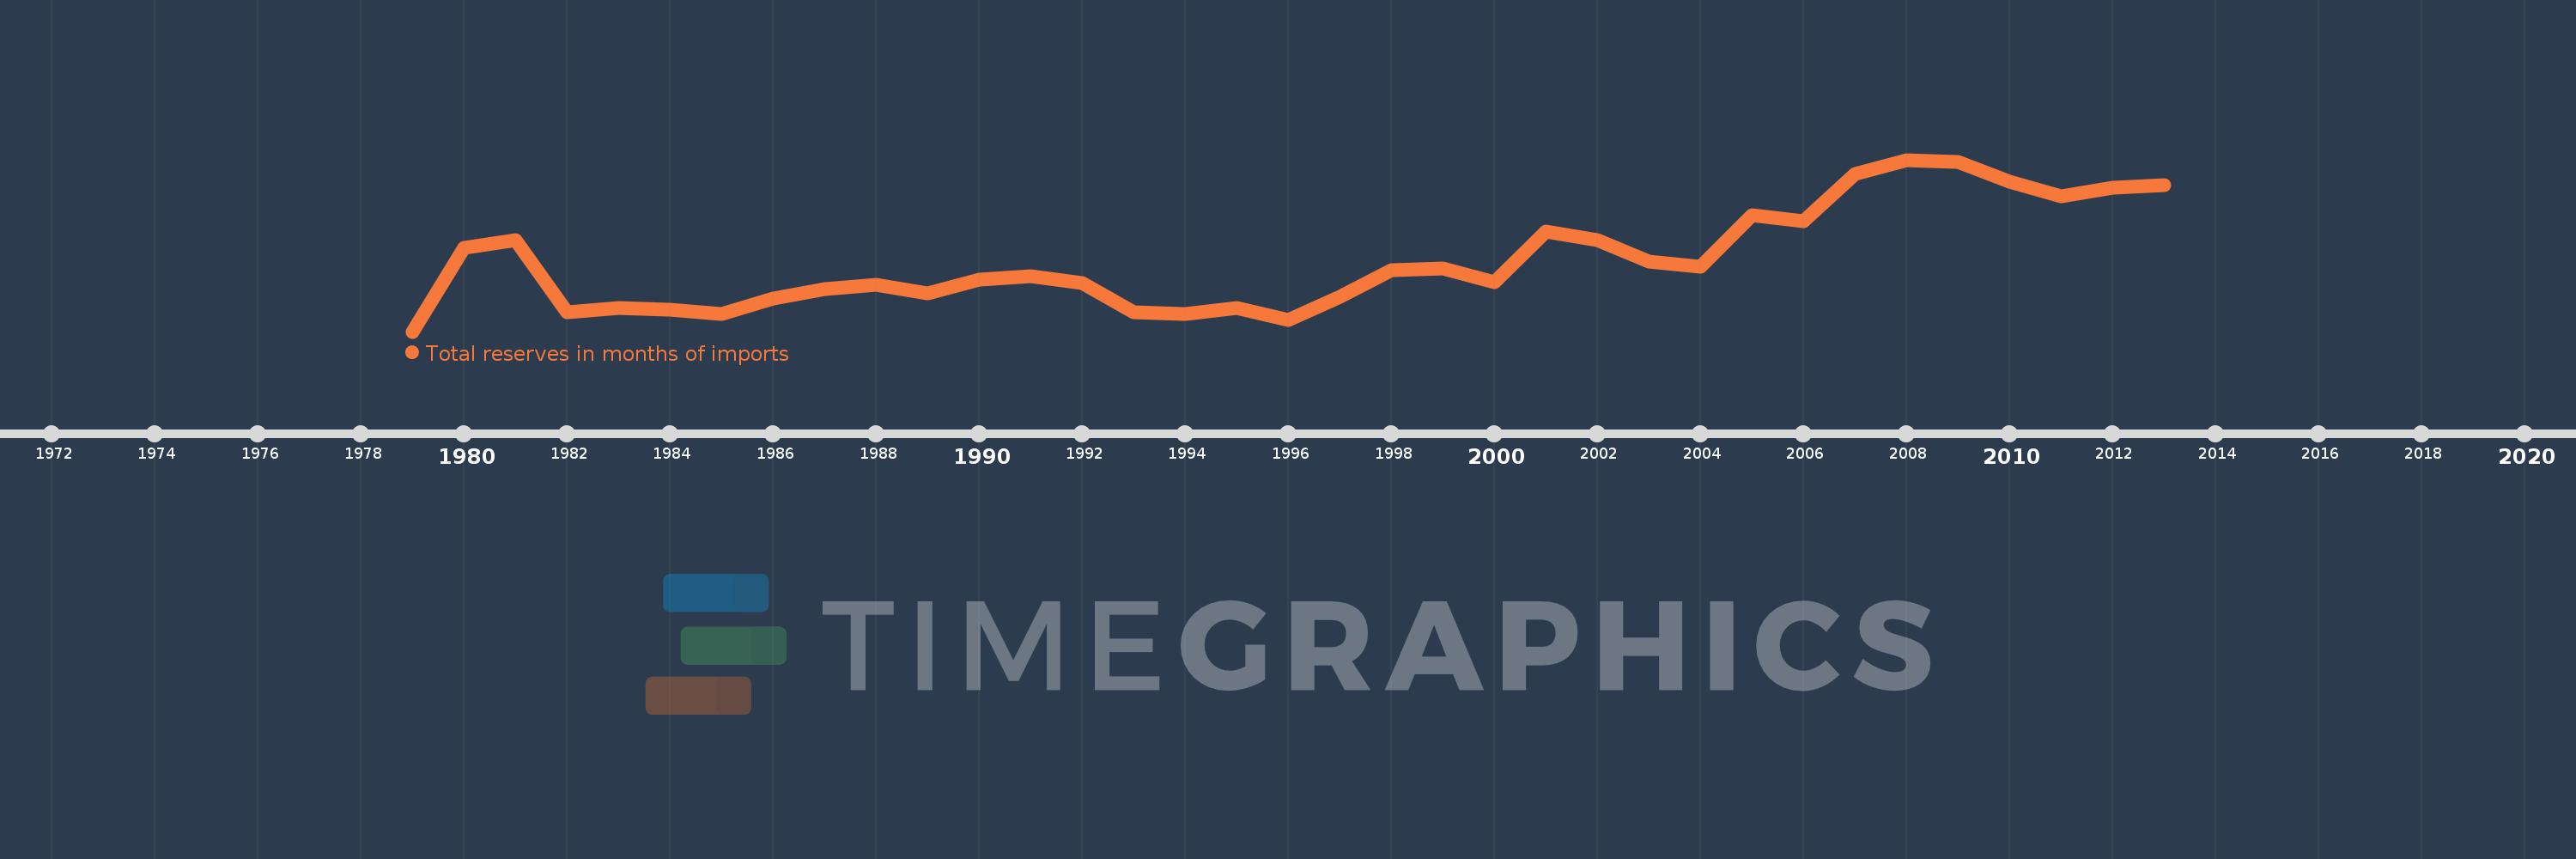
Total reserves in months of imports
2013,2012,2011,2010,2009,2008,2007,2006,2005,2004,2003,2002,2001,2000,1999,1998,1997,1996,1995,1994,1993,1992,1991,1990,1989,1988,1987,1986,1985,1984,1983,1982,1981,1980,1979
Queste statistiche in altri paesi:
AfghanistanAlbaniaAlgeriaAngolaAntigua and BarbudaArab WorldArgentinaArmeniaArubaAustraliaAustriaAzerbaijanBahamas, TheBahrainBangladeshBarbadosBelarusBelgiumBelizeBeninBhutanBoliviaBosnia and HerzegovinaBotswanaBrazilBrunei DarussalamBulgariaBurkina FasoBurundiCabo VerdeCambodiaCameroonCanadaCaribbean small statesCentral African RepublicCentral Europe and the BalticsChadChileChinaColombiaComorosCongo, Dem. Rep.Congo, Rep.Costa RicaCote d'IvoireCroatiaCuracaoCyprusCzech RepublicDenmarkDjiboutiDominicaDominican RepublicEarly-demographic dividendEast Asia & PacificEast Asia & Pacific (excluding high income)East Asia & Pacific (IDA & IBRD countries)EcuadorEgypt, Arab Rep.El SalvadorEquatorial GuineaEritreaEstoniaEthiopiaEuro areaEurope & Central AsiaEurope & Central Asia (excluding high income)Europe & Central Asia (IDA & IBRD countries)European UnionFijiFinlandFragile and conflict affected situationsFranceGabonGambia, TheGeorgiaGermanyGhanaGreeceGrenadaGuatemalaGuineaGuinea-BissauGuyanaHaitiHeavily indebted poor countries (HIPC)High incomeHondurasHong Kong SAR, ChinaHungaryIBRD onlyIcelandIDA & IBRD totalIDA blendIDA onlyIDA totalIndiaIndonesiaIran, Islamic Rep.IraqIrelandIsraelItalyJamaicaJapanJordanKazakhstanKenyaKorea, Rep.KosovoKuwaitKyrgyz RepublicLao PDRLate-demographic dividendLatin America & Caribbean Latin America & Caribbean (excluding high income)Latin America & the Caribbean (IDA & IBRD countries)LatviaLeast developed countries: UN classificationLebanonLesothoLiberiaLibyaLithuaniaLow & middle incomeLow incomeLower middle incomeLuxembourgMacao SAR, ChinaMacedonia, FYRMadagascarMalawiMalaysiaMaldivesMaliMaltaMauritaniaMauritiusMexicoMicronesia, Fed. Sts.Middle East & North AfricaMiddle East & North Africa (excluding high income)Middle East & North Africa (IDA & IBRD countries)Middle incomeMoldovaMongoliaMontenegroMoroccoMozambiqueMyanmarNamibiaNepalNetherlandsNicaraguaNigerNigeriaNorth AmericaNorwayOECD membersOmanOther small statesPacific island small statesPakistanPanamaPapua New GuineaParaguayPeruPhilippinesPolandPortugalPost-demographic dividendPre-demographic dividendQatarRomaniaRussian FederationRwandaSamoaSao Tome and PrincipeSaudi ArabiaSenegalSerbiaSeychellesSierra LeoneSingaporeSlovak RepublicSloveniaSmall statesSolomon IslandsSouth AfricaSouth AsiaSouth Asia (IDA & IBRD)South SudanSpainSri LankaSt. Kitts and NevisSt. LuciaSt. Vincent and the GrenadinesSub-Saharan Africa Sub-Saharan Africa (excluding high income)Sub-Saharan Africa (IDA & IBRD countries)SudanSurinameSwazilandSwedenSwitzerlandSyrian Arab RepublicTajikistanTanzaniaThailandTimor-LesteTogoTongaTrinidad and TobagoTunisiaTurkeyUgandaUkraineUnited KingdomUnited StatesUpper middle incomeUruguayVanuatuVenezuela, RBVietnamWest Bank and GazaWorldYemen, Rep.ZambiaZimbabwe Linea del tempo:
Questa scala temporale mostra un grafico dal 1979 anno al 2013 anno. Pre-demographic dividend. I dati fino ad 1978 anno non disponibili. Il numero di osservazioni attuali secondo i date: 35.
La fonte (nome):
Indicatori dello sviluppo mondiale
La fonte (organizzazione):
International Monetary Fund, International Financial Statistics and data files.
Categorie:
Financial Sector, External Debt
sono stati aggiornati
23 apr 2017 anni
Indicatori delle variazioni dei valori per anni
Minima:
1.619
1 gen 1979 anni
Massimo:
9.307
1 gen 2008 anni
Alla data di osservazione
Valore
Variazione assoluta
La variazione rispetto al valore precedente
1 gen 1979 anni
1.619
+1.619
0.0%
1 gen 1980 anni
5.375
+3.756
232.04%
1 gen 1981 anni
5.708
+0.334
6.21%
1 gen 1982 anni
2.468
-3.24
-56.77%
1 gen 1983 anni
2.669
+0.201
8.16%
1 gen 1984 anni
2.612
-0.058
-2.16%
1 gen 1985 anni
2.408
-0.204
-7.8%
1 gen 1986 anni
3.112
+0.705
29.27%
1 gen 1987 anni
3.511
+0.399
12.81%
1 gen 1988 anni
3.696
+0.185
5.27%
1 gen 1989 anni
3.331
-0.365
-9.88%
1 gen 1990 anni
3.947
+0.616
18.5%
1 gen 1991 anni
4.11
+0.162
4.11%
1 gen 1992 anni
3.794
-0.315
-7.67%
1 gen 1993 anni
2.471
-1.324
-34.88%
1 gen 1994 anni
2.408
-0.063
-2.54%
1 gen 1995 anni
2.672
+0.264
10.97%
1 gen 1996 anni
2.148
-0.524
-19.62%
1 gen 1997 anni
3.17
+1.022
47.6%
1 gen 1998 anni
4.38
+1.21
38.16%
1 gen 1999 anni
4.441
+0.061
1.4%
1 gen 2000 anni
3.848
-0.593
-13.35%
1 gen 2001 anni
6.116
+2.268
58.92%
1 gen 2002 anni
5.731
-0.385
-6.29%
1 gen 2003 anni
4.766
-0.966
-16.85%
1 gen 2004 anni
4.515
-0.251
-5.26%
1 gen 2005 anni
6.82
+2.305
51.05%
1 gen 2006 anni
6.565
-0.255
-3.74%
1 gen 2007 anni
8.689
+2.124
32.36%
1 gen 2008 anni
9.307
+0.618
7.12%
1 gen 2009 anni
9.223
-0.084
-0.91%
1 gen 2010 anni
8.337
-0.886
-9.6%
1 gen 2011 anni
7.667
-0.67
-8.04%
1 gen 2012 anni
8.073
+0.406
5.29%
1 gen 2013 anni
8.179
+0.107
1.32%
Classificazione dei paesi secondo i statistiche attuali per anni


Commenti: