29
/it/
it
AIzaSyAYiBZKx7MnpbEhh9jyipgxe19OcubqV5w
April 1, 2024
54376
Pacific island small states
PSS
false
2
1
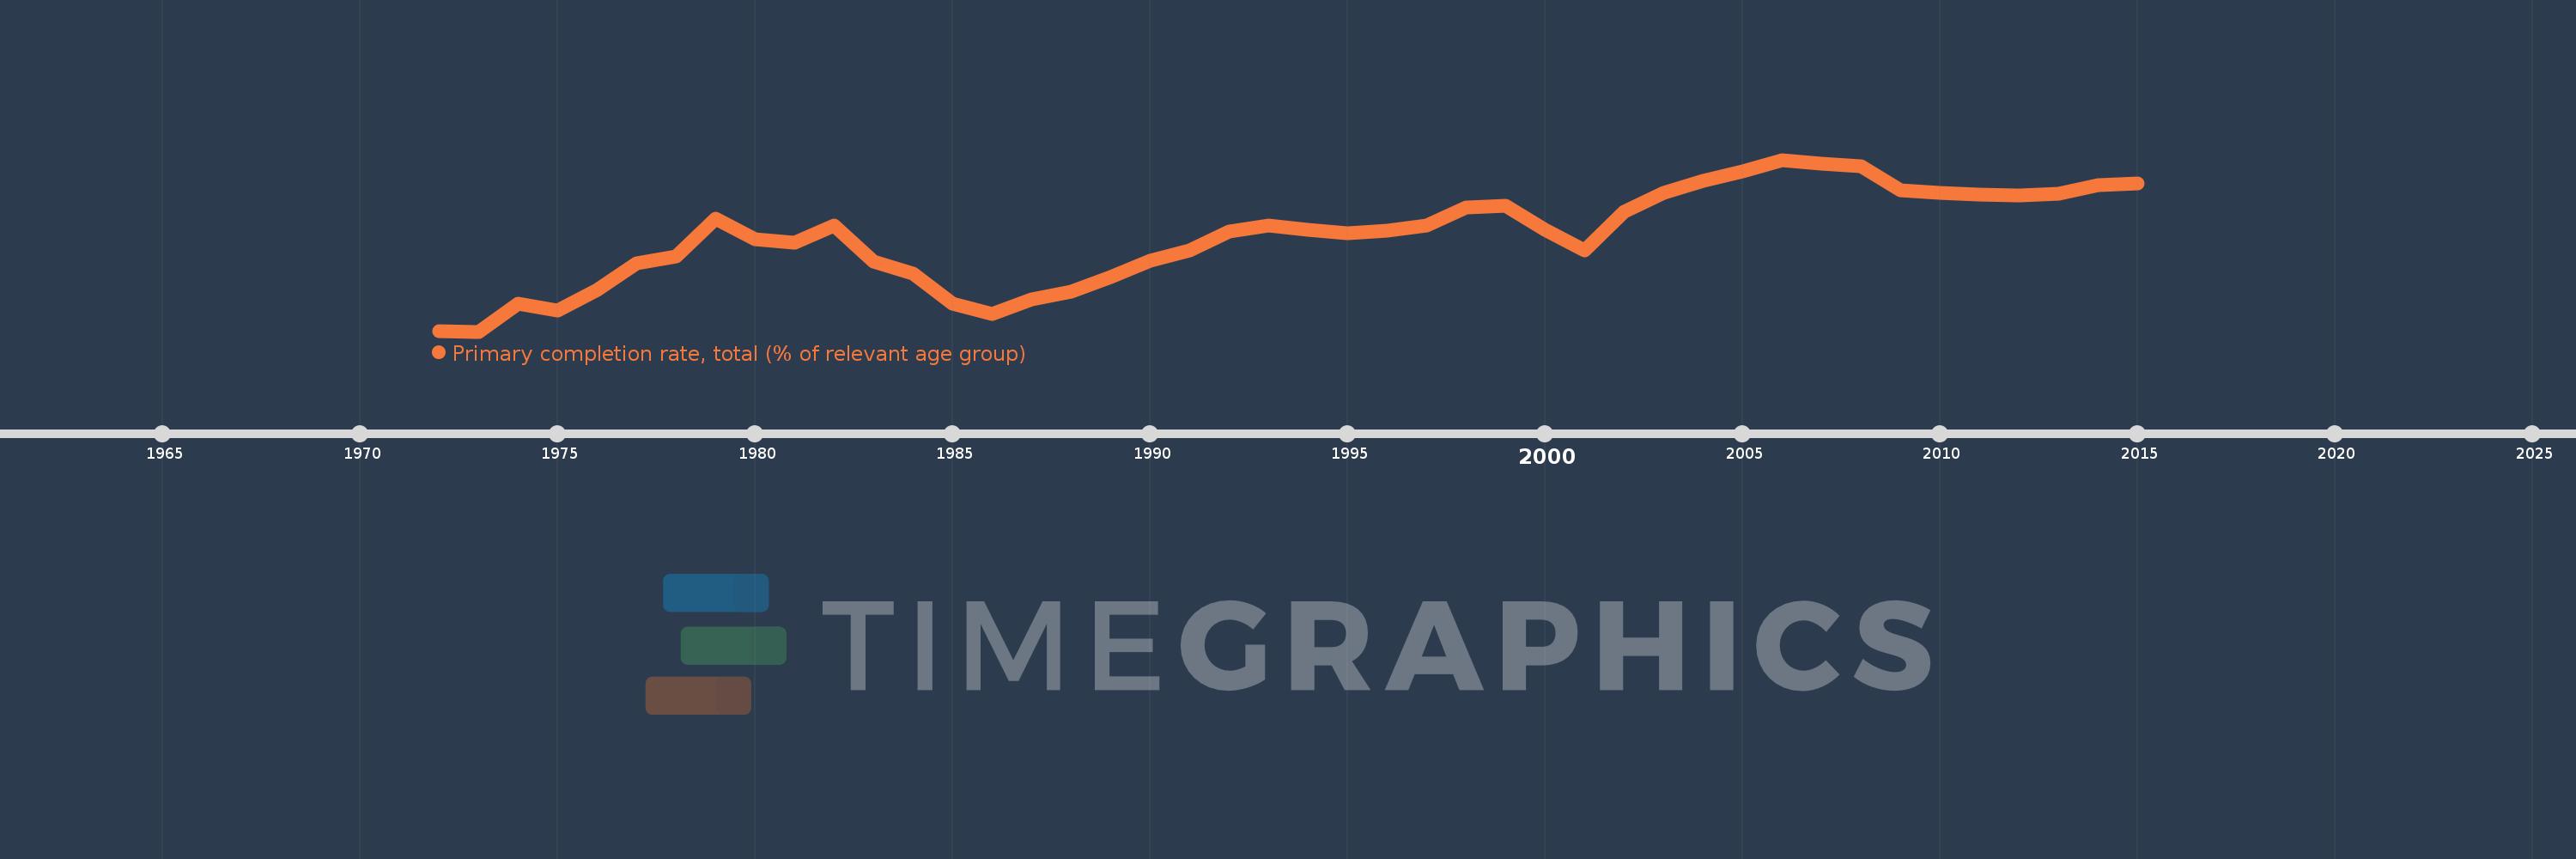
Primary completion rate, total (% of relevant age group)
2015,2014,2013,2012,2011,2010,2009,2008,2007,2006,2005,2004,2003,2002,2001,2000,1999,1998,1997,1996,1995,1994,1993,1992,1991,1990,1989,1988,1987,1986,1985,1984,1983,1982,1981,1980,1979,1978,1977,1976,1975,1974,1973,1972
Queste statistiche in altri paesi:
AfghanistanAlbaniaAlgeriaAngolaAntigua and BarbudaArab WorldArgentinaArmeniaArubaAustriaAzerbaijanBahamas, TheBahrainBangladeshBarbadosBelarusBelgiumBelizeBeninBermudaBhutanBoliviaBosnia and HerzegovinaBotswanaBrazilBritish Virgin IslandsBrunei DarussalamBulgariaBurkina FasoBurundiCabo VerdeCambodiaCameroonCanadaCaribbean small statesCentral African RepublicCentral Europe and the BalticsChadChileChinaColombiaComorosCongo, Dem. Rep.Congo, Rep.Costa RicaCote d'IvoireCroatiaCubaCyprusCzech RepublicDenmarkDjiboutiDominicaDominican RepublicEarly-demographic dividendEast Asia & PacificEast Asia & Pacific (excluding high income)East Asia & Pacific (IDA & IBRD countries)EcuadorEgypt, Arab Rep.El SalvadorEquatorial GuineaEritreaEstoniaEthiopiaEuro areaEurope & Central AsiaEurope & Central Asia (excluding high income)Europe & Central Asia (IDA & IBRD countries)European UnionFijiFinlandFragile and conflict affected situationsFranceGabonGambia, TheGeorgiaGermanyGhanaGreeceGrenadaGuatemalaGuineaGuinea-BissauGuyanaHaitiHeavily indebted poor countries (HIPC)High incomeHondurasHong Kong SAR, ChinaHungaryIBRD onlyIcelandIDA & IBRD totalIDA blendIDA onlyIDA totalIndiaIndonesiaIran, Islamic Rep.IraqIrelandIsraelItalyJamaicaJapanJordanKazakhstanKenyaKiribatiKorea, Dem. People’s Rep.Korea, Rep.KuwaitKyrgyz RepublicLao PDRLate-demographic dividendLatin America & Caribbean Latin America & Caribbean (excluding high income)Latin America & the Caribbean (IDA & IBRD countries)LatviaLeast developed countries: UN classificationLebanonLesothoLiberiaLibyaLiechtensteinLithuaniaLow & middle incomeLow incomeLower middle incomeLuxembourgMacao SAR, ChinaMacedonia, FYRMadagascarMalawiMalaysiaMaldivesMaliMaltaMarshall IslandsMauritaniaMauritiusMexicoMiddle East & North AfricaMiddle East & North Africa (excluding high income)Middle East & North Africa (IDA & IBRD countries)Middle incomeMoldovaMongoliaMontenegroMoroccoMozambiqueMyanmarNamibiaNauruNepalNetherlandsNew ZealandNicaraguaNigerNigeriaNorwayOECD membersOmanOther small statesPacific island small statesPakistanPalauPanamaPapua New GuineaParaguayPeruPhilippinesPolandPortugalPost-demographic dividendPre-demographic dividendQatarRomaniaRussian FederationRwandaSamoaSan MarinoSao Tome and PrincipeSaudi ArabiaSenegalSerbiaSeychellesSierra LeoneSlovak RepublicSloveniaSmall statesSolomon IslandsSouth AfricaSouth AsiaSouth Asia (IDA & IBRD)South SudanSpainSri LankaSt. Kitts and NevisSt. LuciaSt. Vincent and the GrenadinesSub-Saharan Africa Sub-Saharan Africa (excluding high income)Sub-Saharan Africa (IDA & IBRD countries)SudanSurinameSwazilandSwedenSwitzerlandSyrian Arab RepublicTajikistanTanzaniaThailandTimor-LesteTogoTongaTrinidad and TobagoTunisiaTurkeyTuvaluUgandaUkraineUnited Arab EmiratesUpper middle incomeUruguayUzbekistanVanuatuVenezuela, RBVietnamWest Bank and GazaWorldYemen, Rep.ZambiaZimbabwe Linea del tempo:
Questa scala temporale mostra un grafico dal 1972 anno al 2015 anno. Pacific island small states. I dati fino ad 1971 anno non disponibili. Il numero di osservazioni attuali secondo i date: 44.
La fonte (nome):
Indicatori dello sviluppo mondiale
La fonte (organizzazione):
United Nations Educational, Scientific, and Cultural Organization (UNESCO) Institute for Statistics.
Categorie:
Aid Effectiveness, Climate Change, Education
sono stati aggiornati
23 apr 2017 anni
Indicatori delle variazioni dei valori per anni
Minima:
84.058
1 gen 1973 anni
Massimo:
100.062
1 gen 2006 anni
Alla data di osservazione
Valore
Variazione assoluta
La variazione rispetto al valore precedente
1 gen 1972 anni
84.124
+84.124
0.0%
1 gen 1973 anni
84.058
-0.066
-0.08%
1 gen 1974 anni
86.64
+2.582
3.07%
1 gen 1975 anni
86.057
-0.584
-0.67%
1 gen 1976 anni
87.969
+1.912
2.22%
1 gen 1977 anni
90.45
+2.481
2.82%
1 gen 1978 anni
91.039
+0.589
0.65%
1 gen 1979 anni
94.601
+3.562
3.91%
1 gen 1980 anni
92.698
-1.903
-2.01%
1 gen 1981 anni
92.306
-0.392
-0.42%
1 gen 1982 anni
93.926
+1.621
1.76%
1 gen 1983 anni
90.606
-3.32
-3.53%
1 gen 1984 anni
89.498
-1.109
-1.22%
1 gen 1985 anni
86.688
-2.81
-3.14%
1 gen 1986 anni
85.708
-0.98
-1.13%
1 gen 1987 anni
87.055
+1.347
1.57%
1 gen 1988 anni
87.801
+0.746
0.86%
1 gen 1989 anni
89.109
+1.308
1.49%
1 gen 1990 anni
90.652
+1.543
1.73%
1 gen 1991 anni
91.656
+1.004
1.11%
1 gen 1992 anni
93.393
+1.737
1.9%
1 gen 1993 anni
93.911
+0.518
0.56%
1 gen 1994 anni
93.57
-0.341
-0.36%
1 gen 1995 anni
93.187
-0.383
-0.41%
1 gen 1996 anni
93.49
+0.303
0.32%
1 gen 1997 anni
93.977
+0.487
0.52%
1 gen 1998 anni
95.644
+1.667
1.77%
1 gen 1999 anni
95.754
+0.11
0.12%
1 gen 2000 anni
93.575
-2.179
-2.28%
1 gen 2001 anni
91.658
-1.917
-2.05%
1 gen 2002 anni
95.19
+3.531
3.85%
1 gen 2003 anni
97.0
+1.811
1.9%
1 gen 2004 anni
98.099
+1.098
1.13%
1 gen 2005 anni
98.999
+0.9
0.92%
1 gen 2006 anni
100.062
+1.063
1.07%
1 gen 2007 anni
99.688
-0.374
-0.37%
1 gen 2008 anni
99.423
-0.265
-0.27%
1 gen 2009 anni
97.222
-2.2
-2.21%
1 gen 2010 anni
97.018
-0.205
-0.21%
1 gen 2011 anni
96.813
-0.205
-0.21%
1 gen 2012 anni
96.747
-0.066
-0.07%
1 gen 2013 anni
96.907
+0.16
0.17%
1 gen 2014 anni
97.712
+0.805
0.83%
1 gen 2015 anni
97.878
+0.167
0.17%
Classificazione dei paesi secondo i statistiche attuali per anni


Commenti: