29
/it/
it
AIzaSyAYiBZKx7MnpbEhh9jyipgxe19OcubqV5w
April 1, 2024
53836
Other small states
OSS
false
2
1
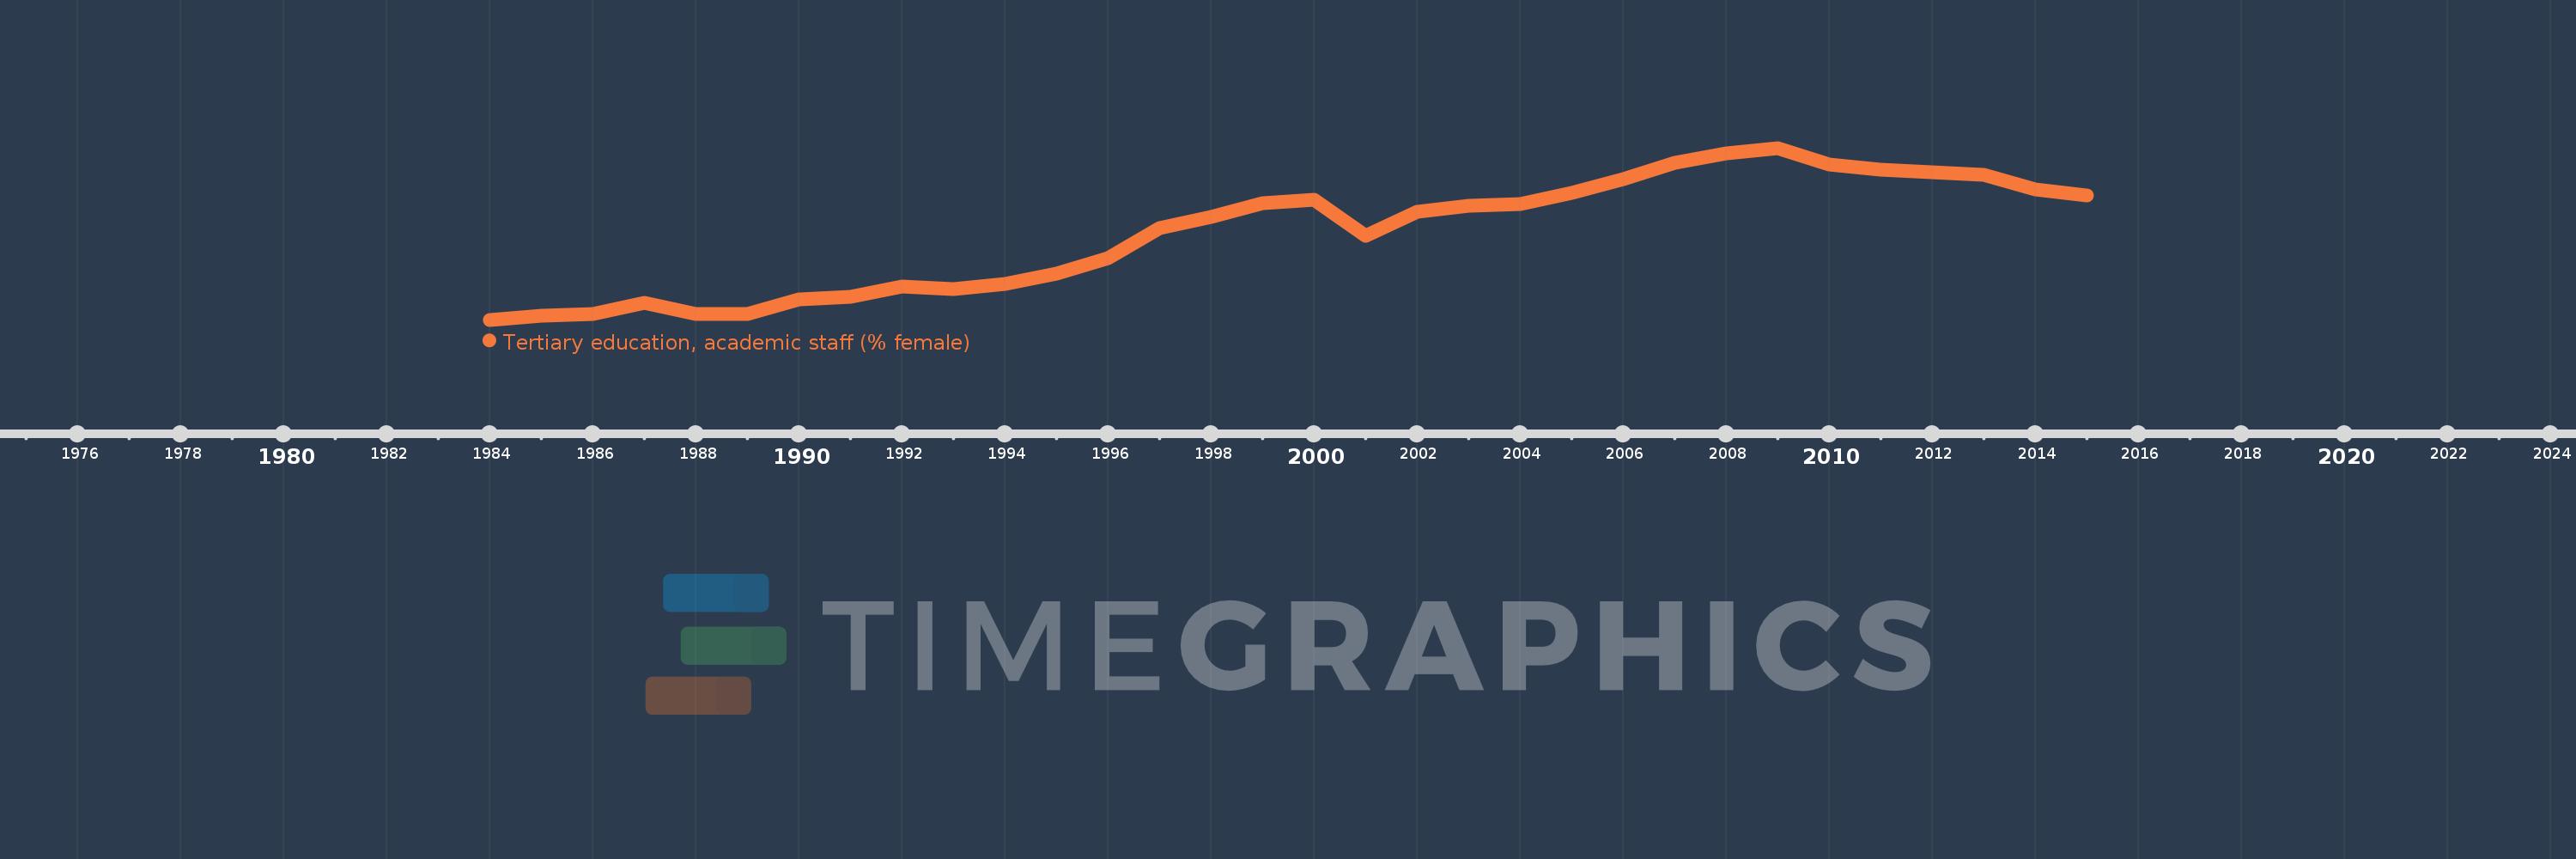
Tertiary education, academic staff (% female)
2015,2014,2013,2012,2011,2010,2009,2008,2007,2006,2005,2004,2003,2002,2001,2000,1999,1998,1997,1996,1995,1994,1993,1992,1991,1990,1989,1988,1987,1986,1985,1984
Queste statistiche in altri paesi:
AfghanistanAlbaniaAlgeriaAndorraAngolaAntigua and BarbudaArab WorldArgentinaArmeniaArubaAustraliaAustriaAzerbaijanBahamas, TheBahrainBangladeshBarbadosBelarusBelgiumBelizeBeninBermudaBhutanBoliviaBosnia and HerzegovinaBotswanaBrazilBritish Virgin IslandsBrunei DarussalamBulgariaBurkina FasoBurundiCabo VerdeCambodiaCameroonCanadaCaribbean small statesCayman IslandsCentral African RepublicCentral Europe and the BalticsChadChileChinaColombiaComorosCongo, Dem. Rep.Congo, Rep.Costa RicaCote d'IvoireCroatiaCubaCyprusCzech RepublicDenmarkDjiboutiDominicaDominican RepublicEarly-demographic dividendEast Asia & PacificEast Asia & Pacific (excluding high income)East Asia & Pacific (IDA & IBRD countries)EcuadorEgypt, Arab Rep.El SalvadorEquatorial GuineaEritreaEstoniaEthiopiaEuro areaEurope & Central AsiaEurope & Central Asia (excluding high income)Europe & Central Asia (IDA & IBRD countries)European UnionFijiFinlandFragile and conflict affected situationsFranceGabonGambia, TheGeorgiaGermanyGhanaGreeceGrenadaGuineaGuyanaHaitiHeavily indebted poor countries (HIPC)High incomeHondurasHong Kong SAR, ChinaHungaryIBRD onlyIcelandIDA & IBRD totalIDA blendIDA onlyIDA totalIndiaIndonesiaIran, Islamic Rep.IraqIrelandItalyJamaicaJapanJordanKazakhstanKorea, Dem. People’s Rep.Korea, Rep.KuwaitKyrgyz RepublicLao PDRLate-demographic dividendLatin America & Caribbean Latin America & Caribbean (excluding high income)Latin America & the Caribbean (IDA & IBRD countries)LatviaLeast developed countries: UN classificationLebanonLesothoLiberiaLibyaLiechtensteinLithuaniaLow & middle incomeLow incomeLower middle incomeLuxembourgMacao SAR, ChinaMacedonia, FYRMadagascarMalawiMalaysiaMaldivesMaliMaltaMarshall IslandsMauritaniaMauritiusMicronesia, Fed. Sts.Middle East & North AfricaMiddle East & North Africa (excluding high income)Middle East & North Africa (IDA & IBRD countries)Middle incomeMoldovaMongoliaMoroccoMozambiqueMyanmarNamibiaNepalNetherlandsNew ZealandNicaraguaNigerNigeriaNorth AmericaNorwayOECD membersOmanOther small statesPacific island small statesPakistanPalauPanamaPapua New GuineaPeruPhilippinesPolandPortugalPost-demographic dividendPre-demographic dividendPuerto RicoQatarRomaniaRussian FederationRwandaSamoaSao Tome and PrincipeSaudi ArabiaSenegalSerbiaSeychellesSierra LeoneSingaporeSint Maarten (Dutch part)Slovak RepublicSloveniaSmall statesSomaliaSouth AfricaSouth AsiaSouth Asia (IDA & IBRD)SpainSri LankaSt. Kitts and NevisSt. LuciaSt. Vincent and the GrenadinesSub-Saharan Africa Sub-Saharan Africa (excluding high income)Sub-Saharan Africa (IDA & IBRD countries)SudanSurinameSwazilandSwedenSwitzerlandSyrian Arab RepublicTajikistanTanzaniaThailandTimor-LesteTogoTongaTrinidad and TobagoTunisiaTurkeyTurkmenistanUgandaUnited Arab EmiratesUnited KingdomUnited StatesUpper middle incomeUruguayUzbekistanVenezuela, RBVietnamWest Bank and GazaWorldYemen, Rep.Zimbabwe Linea del tempo:
Questa scala temporale mostra un grafico dal 1984 anno al 2015 anno. Other small states. I dati fino ad 1983 anno non disponibili. Il numero di osservazioni attuali secondo i date: 32.
La fonte (nome):
Indicatori dello sviluppo mondiale
La fonte (organizzazione):
United Nations Educational, Scientific, and Cultural Organization (UNESCO) Institute for Statistics.
Categorie:
Education
sono stati aggiornati
23 apr 2017 anni
Indicatori delle variazioni dei valori per anni
Minima:
33.666
1 gen 1984 anni
Massimo:
41.589
1 gen 2009 anni
Alla data di osservazione
Valore
Variazione assoluta
La variazione rispetto al valore precedente
1 gen 1984 anni
33.666
+33.666
0.0%
1 gen 1985 anni
33.848
+0.182
0.54%
1 gen 1986 anni
33.924
+0.076
0.22%
1 gen 1987 anni
34.447
+0.523
1.54%
1 gen 1988 anni
33.935
-0.513
-1.49%
1 gen 1989 anni
33.92
-0.015
-0.04%
1 gen 1990 anni
34.611
+0.691
2.04%
1 gen 1991 anni
34.721
+0.111
0.32%
1 gen 1992 anni
35.185
+0.464
1.34%
1 gen 1993 anni
35.098
-0.088
-0.25%
1 gen 1994 anni
35.302
+0.204
0.58%
1 gen 1995 anni
35.813
+0.512
1.45%
1 gen 1996 anni
36.488
+0.675
1.88%
1 gen 1997 anni
37.881
+1.393
3.82%
1 gen 1998 anni
38.417
+0.536
1.42%
1 gen 1999 anni
39.051
+0.634
1.65%
1 gen 2000 anni
39.205
+0.154
0.39%
1 gen 2001 anni
37.549
-1.656
-4.22%
1 gen 2002 anni
38.631
+1.083
2.88%
1 gen 2003 anni
38.906
+0.275
0.71%
1 gen 2004 anni
38.983
+0.077
0.2%
1 gen 2005 anni
39.527
+0.544
1.39%
1 gen 2006 anni
40.144
+0.618
1.56%
1 gen 2007 anni
40.897
+0.752
1.87%
1 gen 2008 anni
41.336
+0.44
1.08%
1 gen 2009 anni
41.589
+0.252
0.61%
1 gen 2010 anni
40.824
-0.764
-1.84%
1 gen 2011 anni
40.598
-0.226
-0.55%
1 gen 2012 anni
40.469
-0.13
-0.32%
1 gen 2013 anni
40.359
-0.11
-0.27%
1 gen 2014 anni
39.659
-0.7
-1.73%
1 gen 2015 anni
39.417
-0.241
-0.61%
Classificazione dei paesi secondo i statistiche attuali per anni


Commenti: